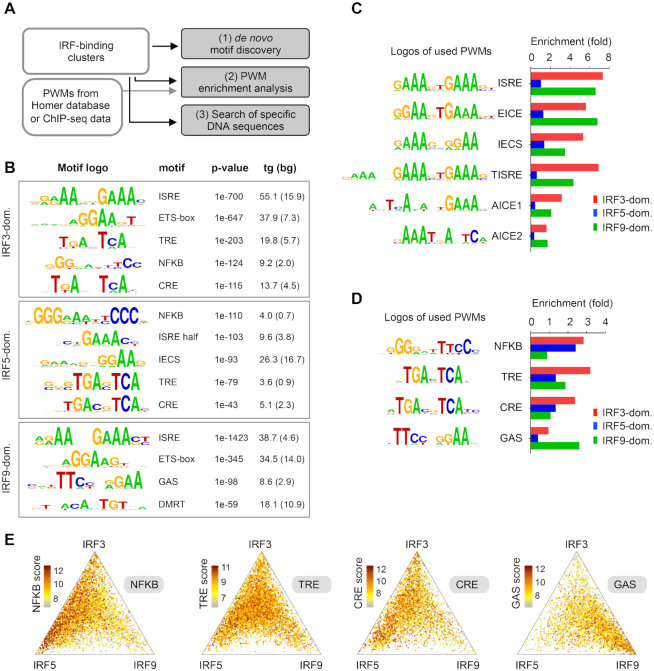
Figure 2.
DNA motifs and sequences in the IRF-binding clusters. (A) A scheme showing the three different strategies for identification of DNA motifs and sequences in the clusters. Position weight matrices, PWMs. (B) Results of de novo motif discovery from the IRF3-, IRF5- and IRF9-dominant clusters. Motif frequencies (%) in the target (tg) and background set (bg) are shown. (C, D) PWM enrichment analysis in three IRF clusters. The enrichment was calculated relative to the random set. PWMs were obtained from the HOMER database or from re-analysed ChIP-seq datasets. (C) The enrichment of six PWMs for IRF-binding DNA sequences and (D) four PWMs for co-activated transcription factors are shown. (E) The distribution of NFKB, TRE, CRE and GAS motifs is shown on ternary plots. The position of each dot in the interior of the triangle was calculated based on the normalized IRF3, IRF5 and IRF9 occupancy values, while colours indicate motif scores. IRF binding regions with motif scores above the cut-offs are shown.

