Figure 4.

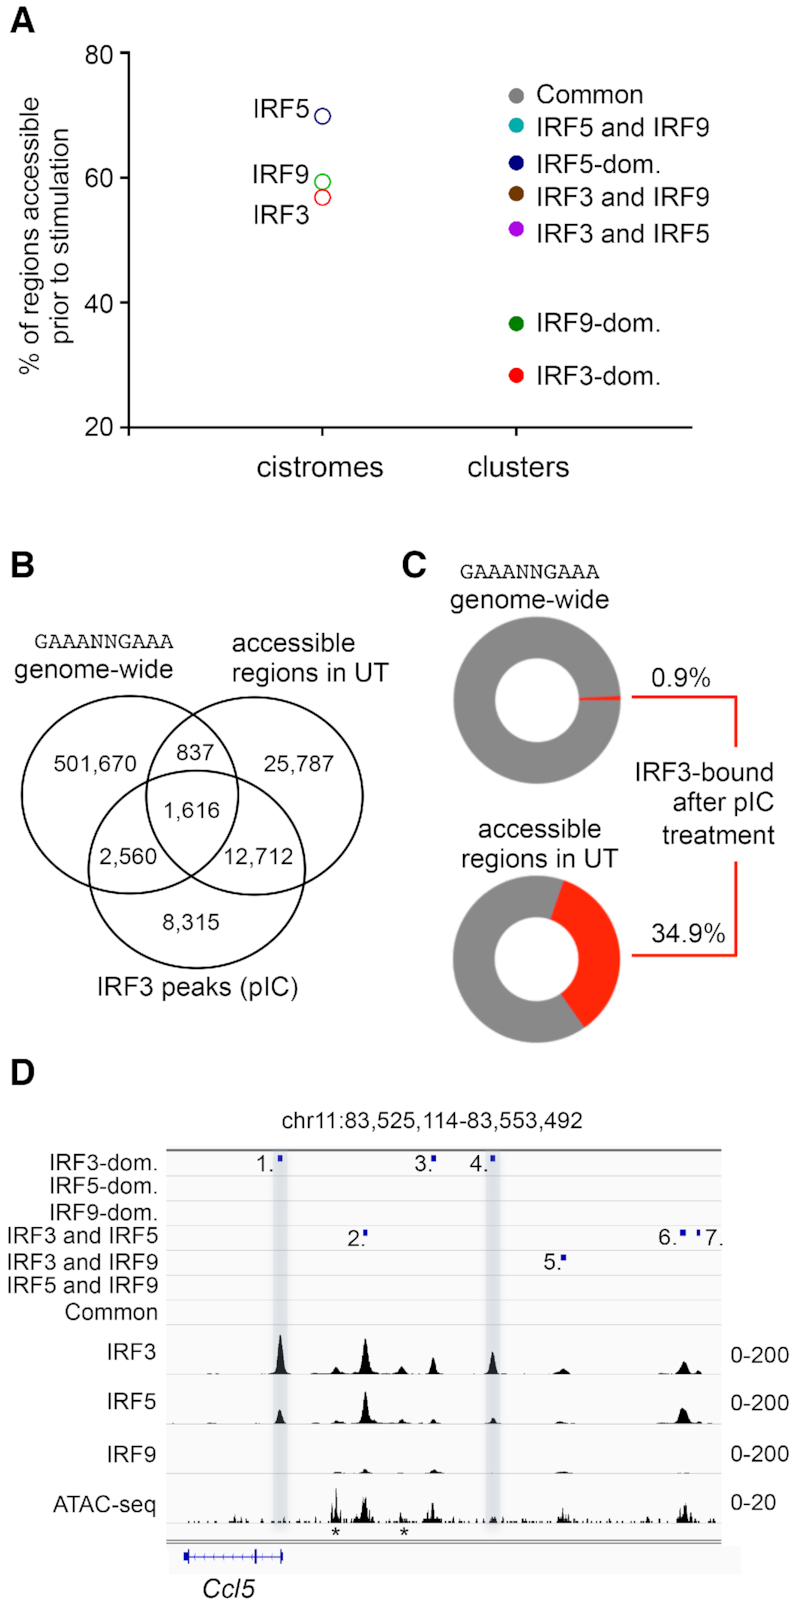
Chromatin accessibility in the IRF cistromes and IRF-binding clusters. (A) The frequency of ATAC-seq positive regions in unstimulated (UT) DCs is shown for the IRF cistromes and IRF-binding clusters. (B) The overlap between the canonical ISRE (GAAANNGAAA) sequence, the accessible genomic regions in unstimulated (UT) DCs, and IRF3-binding regions in pIC-stimulated DCs is shown on a Venn diagram. (C) Percentages of the canonical ISRE (GAAANNGAAA) sequence and accessible genomic regions in unstimulated (UT) DCs, which were bound by IRF3 after pIC-treatment. (D) The genome browser view of the binding of IRF3, IRF5 and IRF9, and the ATAC-seq signal. The positions of mapped binding regions are also shown. Two regions (nos. 1 and 4), which had low or no accessibility prior-to-stimulation and were occupied dominantly by IRF3 upon stimulation, are highlighted. Regions indicated with an asterisk (*) were not identified as IRF binding regions, most likely due to the strict peak calling strategy.
