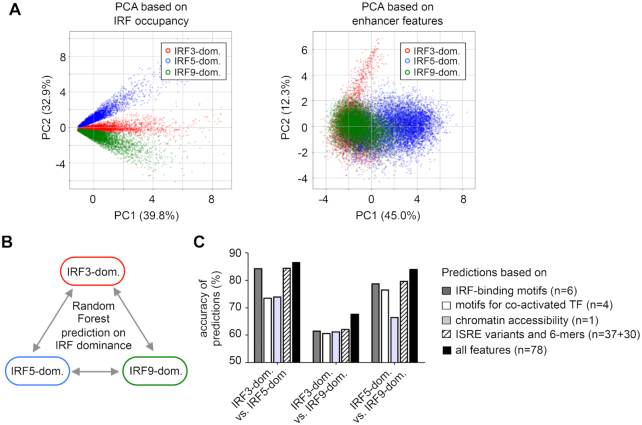
Figure 5.
Analysis of IRF-dominant binding regions by principal component analysis (PCA) and machine learning. (A) PCA of IRF3-, IRF5- and IRF9-dominant clusters based on IRF occupancy values (on the left) and 11 enhancer features (10 motif scores and ATAC-seq signal, on the right). Data points representing individual peaks are colour-coded based on their original cluster labels. (B) A scheme showing the pair-wise comparisons for the Random Forest method. (C) The accuracy of prediction by the Random Forest method using different sets of input variables. The scores for IRF-binding motifs, motifs for co-activated TFs, ATAC-signals, and occurrence data concerning variants of ISRE and 6-mers, or all features were used as input variables for the method. The number of features used for various Random Forest analyses is indicated. The accuracy indicates the percentage of correct predictions (where the original and predicted cluster labels matched) relative to all predictions.

