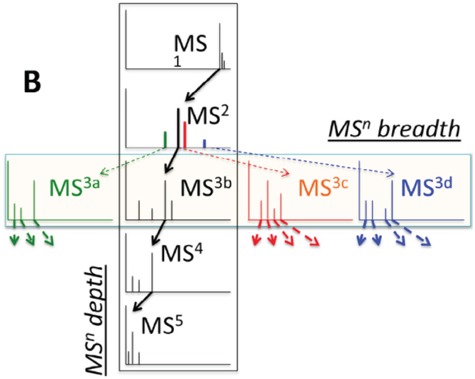
Figure 3.

A mass spectral tree with nodes corresponding to individual mass spectra with different levels. Mass spectral trees are characterized by depth ( level) and breadth (the number of product ions chosen for the subsequent fragmentation). The figure is adapted from [61].
