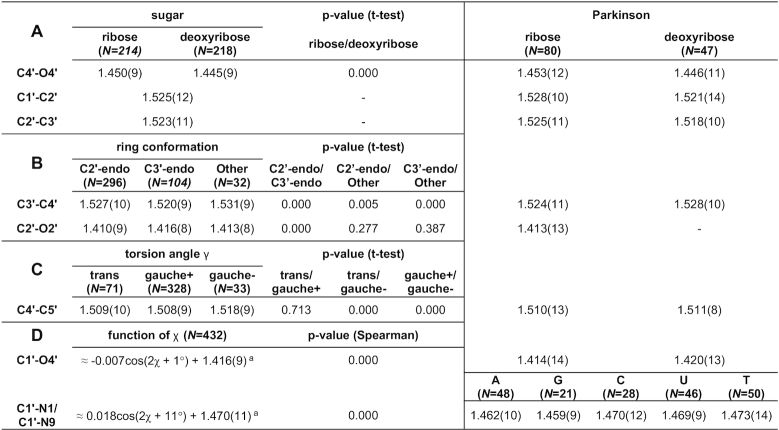
Table 1.
CSD-derived mean values and standard deviations (in parentheses, in units of the last significant digit of the mean value) for sugar bond lengths (in Å)

|
N is the number of cases used to compute a given restraint. A, G, C, U, T, denote adenine, guanine, cytosine, uracil, and thymine. Columns labeled Parkinson report reference values from (3). aFunction definitions presented for bonds C1′-N1/C1′-N9 and C1′-O4′ are approximations obtained using least-squares regression with formula a·cos(x + b) + c for discussion purposes; the Gaussian Process Regression used to obtain the actual restraints is based on example distance and its results cannot be presented in a single formula.
