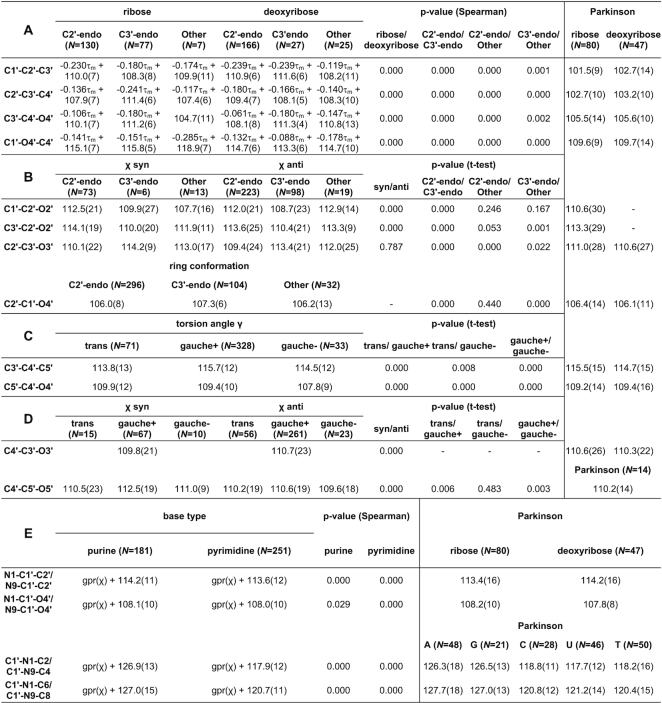
Table 2.
CSD-derived mean values and standard deviations (in parentheses, in units of the last significant digit of the mean value) for sugar bond angles (in °)

|
N is the number of cases used to compute a given restraint. A, G, C, U, T, denote adenine, guanine, cytosine, uracil, and thymine. Columns labeled Parkinson report reference values from (3). gpr(X) denotes a Gaussian Process Regression function of X, with its mean shift given as an added coefficient.
