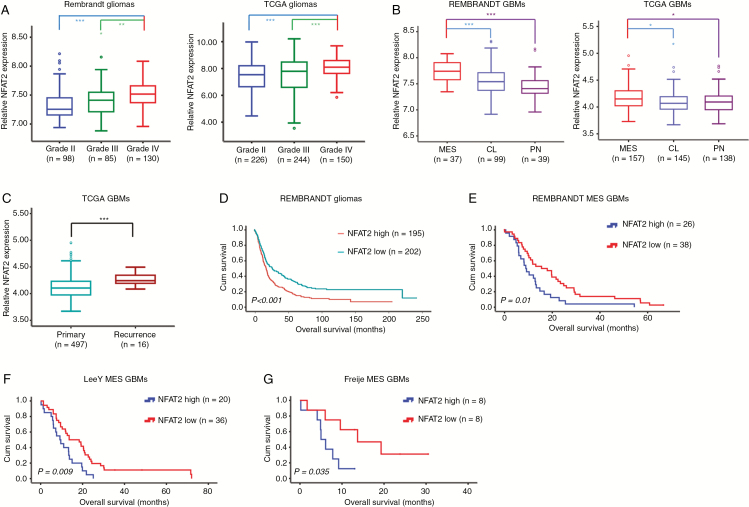
Fig. 1.
Correlation between NFAT2 expression and the clinic-pathologic features of gliomas. (A) NFAT2 mRNA expression is shown according to the histopathologic grades of REMBRANDT and TCGA gliomas. (B) Messenger RNA expression of NFAT2 is shown according to the molecular subtypes of REMBRANDT and TCGA GBMs. (C) NFAT2 mRNA expression is compared between primary and recurrent TCGA GBMs. (D) Prognostic significance of NFAT2 in REMBRANDT gliomas. (E–G) The prognostic significance of NFAT2 in MES GBMs was tested using the REMBRANDT database (E), Lee Y dataset (F), and Freije dataset (G). *P < 0.05, ***P < 0.001.

