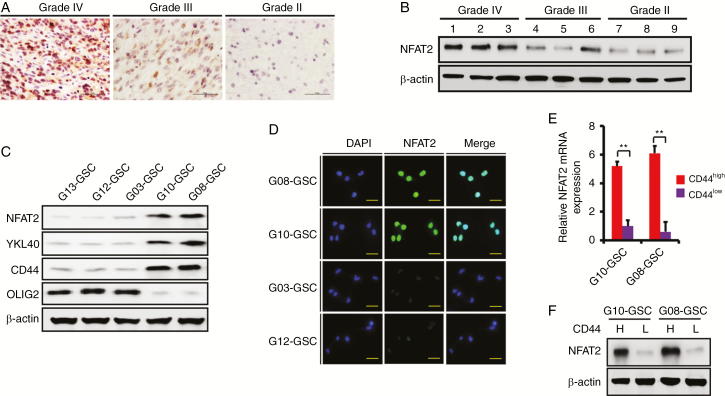
Fig. 2.
NFAT2 expression in primary GSCs. (A) Representative IHC images of NFAT2 expression in WHO grade IV, grade III, and grade II glioma clinical samples. Intense immunostaining was observed in the nuclei of grade IV glioma tissues. Scale bar = 50 μm. (B) Representative WB image of NFAT2 protein expression in WHO grade IV, grade III, and grade II glioma clinical samples. (C) Western blotting shows the expression of NFAT2, YKL40, CD44, and Olig2 in the indicated GSCs. (D) Immunofluorescence of NFAT2 in the primary GSCs. Scale bar = 25 μm. (E, F) The expression of NFAT2 in CD44high and CD44low GSCs was examined by real-time PCR (E) and WB (F). Results are presented as mean ± SD of triplicate samples from 3 independent experiments. *P< 0.05 and **P< 0.01.

