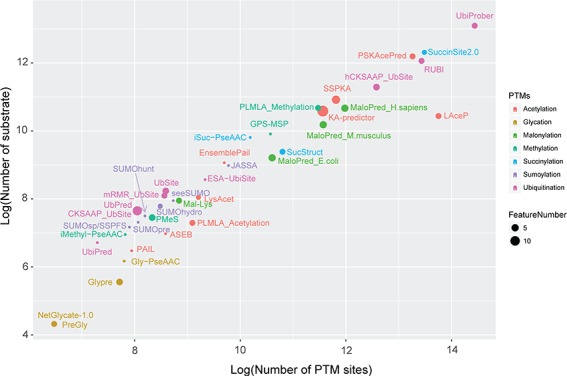
Figure 1.

Bubble plots showing the sizes of data sets and the numbers of features for each method surveyed in this article. The x-axis shows the log2 value of the numbers of PTM sites, while the y-axis denotes the log2 of numbers of substrates. The dot size indicates the numbers of features calculated in individual method.
