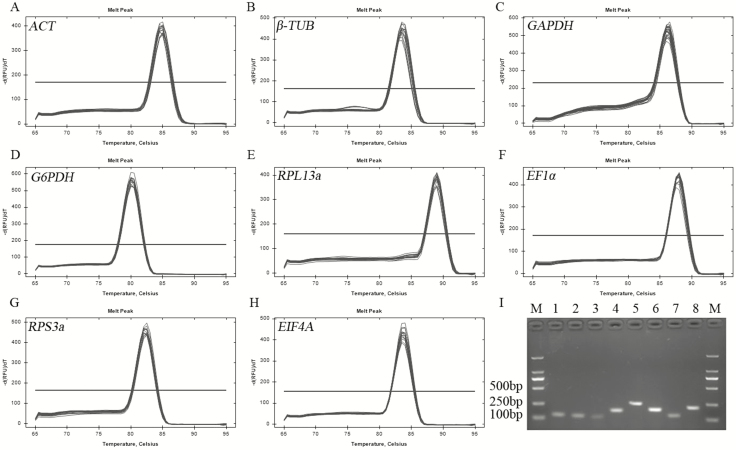
Fig. 1.
Amplification specificities of eight candidate reference gene primers in qRT-PCR and RT-PCR. (A–H) Melt curve analysis of eight candidate genes. (I) Agarose gel electrophoresis results of PCR products amplified by eight specific primer pairs. Lane M, DNA 2000 Marker, and lane 1–8, ACT, β-TUB, GAPDH, G6PDH, RPL13a, EF1α, RPS3a, EIF4A.

