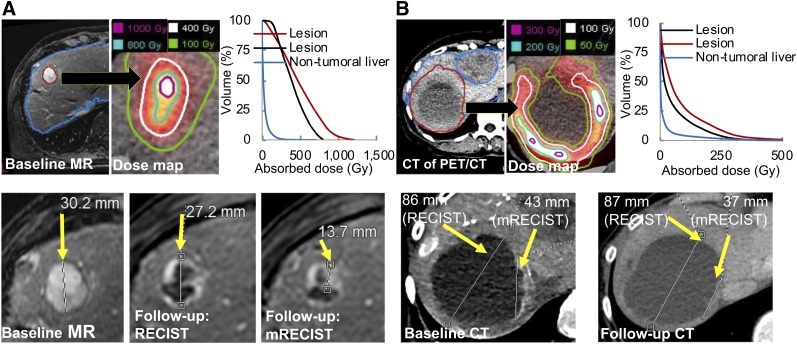
FIGURE 2.
Two patient examples showing lesion and nontumoral liver segmentation on baseline MR (A) or CT of PET/CT (B). PET/CT-derived dose maps with isodose contours and dose–volume histograms (top row) and RECIST/mRECIST-based response assessment (bottom row) are also shown. In A, lesion-level classification was stable disease (nonresponding) according to RECIST but partial response (responding) according to mRECIST. In B, classification was stable disease according to both criteria. Not all lesions are shown.

