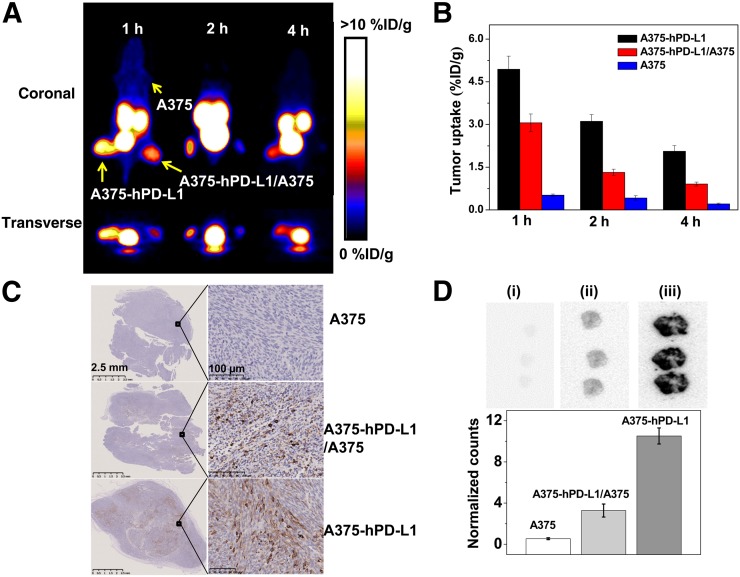
FIGURE 5.
PET imaging of tumor-bearing models. (A) Static images at 1, 2, and 4 h after injection of 2.5 MBq of 68Ga-NOTA-Nb109 (n = 3). (B) Uptake of 68Ga-NOTA-Nb109 in tumors according to quantification analysis of PET images. (C) PD-L1 immunohistochemical staining of tumors (n = 5, scale bar = 2.5 mm in left column and 100 μm in right column). (D) Autoradiography analysis of 68Ga-NOTA-Nb109 in A375 (i), A375/A375-hPD-L1 (ii), and A375-hPD-L1 (iii) tumor (top) and quantitative analysis of autoradiography (bottom).

