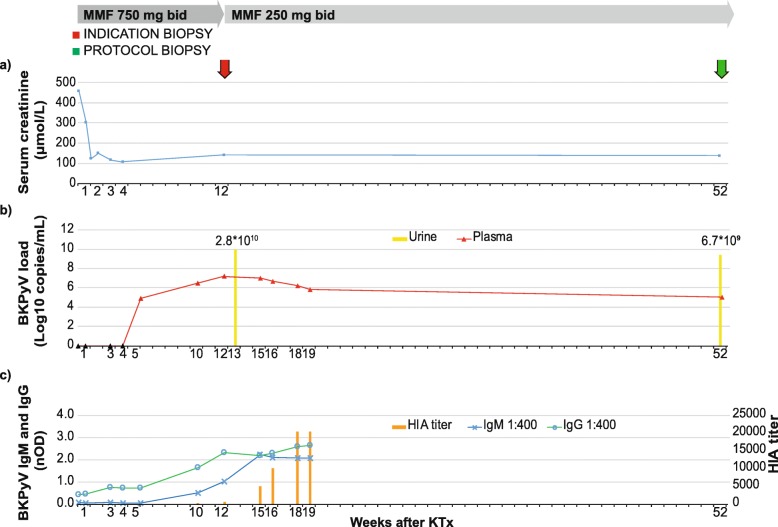
Fig. 1.
Treatment and Clinical Course of Recipient #1. The X-axis is labeled with the week after transplantation when the sample was taken. Arrows indicate biopsies. Y-axis: a Serum creatinine concentration in μmol/L. b BKPyV-DNA genome levels in plasma (red triangles) and in urine (yellow bar) in log10 c/mL. Retrospectively tested plasma samples (black triangles). c BKPyV-antibody IgG (green line) and IgM (blue line) shown as nOD at the left Y-axis; HIA-titer (orange bar) at the right Y-axis

