Fig. 2.
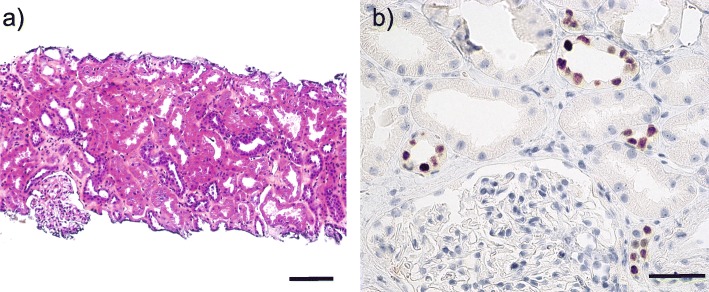
Histological analysis of a renal allograft biopsy from recipient #1 at 12 weeks post-transplant. a HES (hematoxylin, eosin and saffron) stained section. Original magnification 200x, scale bar =100 μm. b Immunohistochemistry staining of the same biopsy as in a), viral LTag expression (brown colour) in tubular epithelial cells using the cross-reacting monoclonal anti-SV40 LTag antibody Pab416 (Merck). Original magnification 400x, scale bar =50 μm

