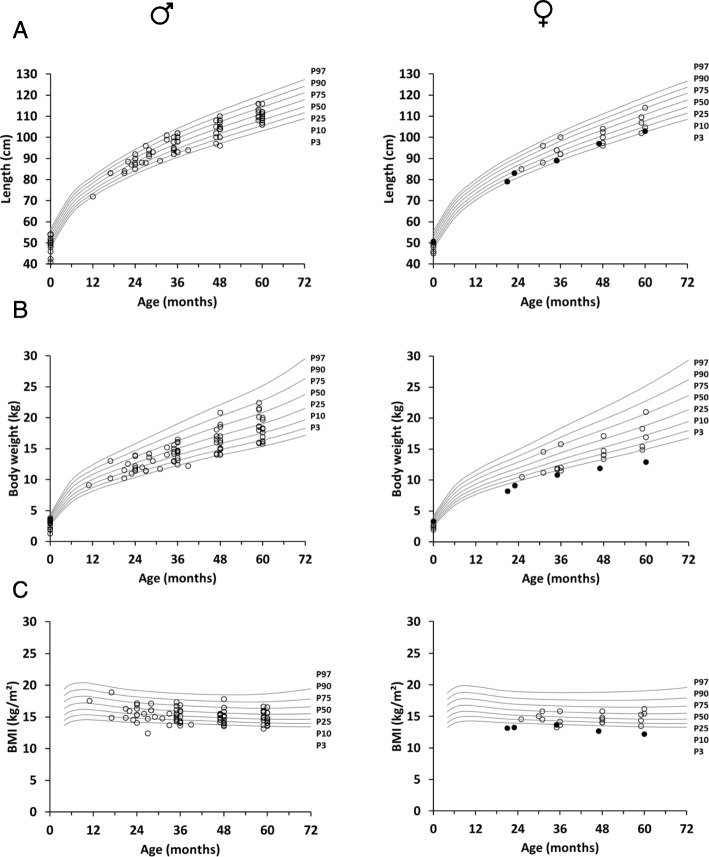
Fig. 2.
Growth charts of subjects with XLHED between 0 and 60 months of age in comparison with standardized percentiles for the normal population depicting a length-for-age (cm), b weight-for-age (kg), and c BMI-for-age (kg/m2) [21]. The filled circles represent a girl from Israel with normal birth weight but obvious growth retardation later on

