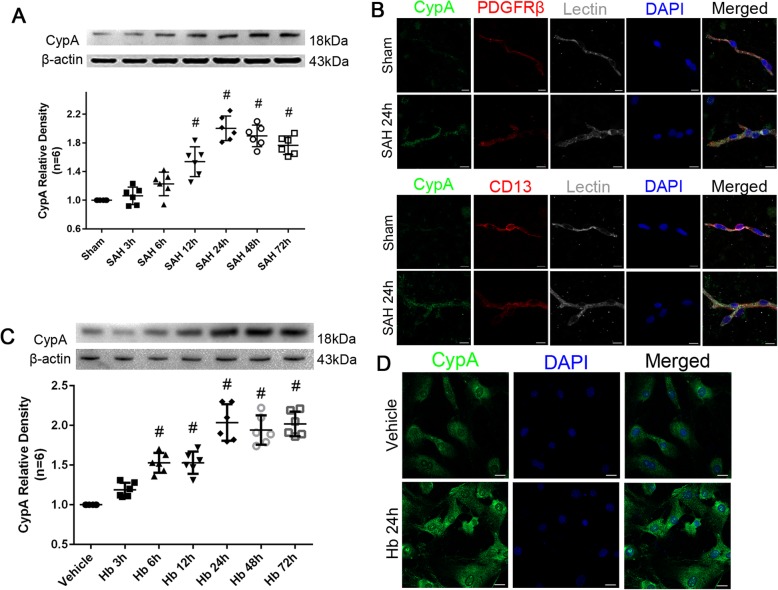
Fig. 1.
Time course of endogenous CypA in pericyte after subarachnoid hemorrhage. a Representative western blot bands and quantitative analysis of CypA from ipsilateral hemisphere after SAH. b Representative immunohistochemistry staining slices of CypA (Green), PDGFRβ/CD13 (Red), and Lectin (White) at 24 h after SAH. c Representative western blot bands and quantitative analysis of CypA expressions in cultured pericytes after Hb stimulation. d Representative immunohistochemistry staining of CypA (Green) in cultured pericytes at 24 h after Hb stimulation. Relative densities of each protein have been normalized against the sham group. n = 6 in panel a, n = 6 in panel c; #: vs. sham P < 0.05

