Fig. 1.
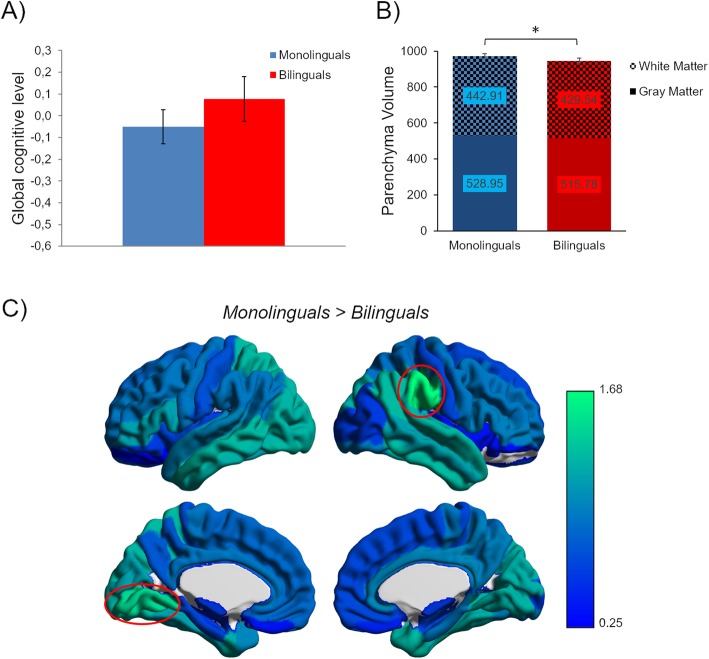
Cross-sectional results. a Mean and standard error bars for global cognitive level measure. b Mean and standard error bars for parenchyma volume (cm3). The graph is stratified in order to show the contribution of gray matter and white matter. *Significant differences at a threshold of p < 0.05. c Region-based morphometry results. The figure shows the brain parcels of the LPBA40 atlas. Red circles show the areas with significant gray matter volume reduction in bilinguals compared to monolinguals (p < 0.05 FDR corrected). The color bar represents the corrected log-scale p value FDR applicable to each parcel

