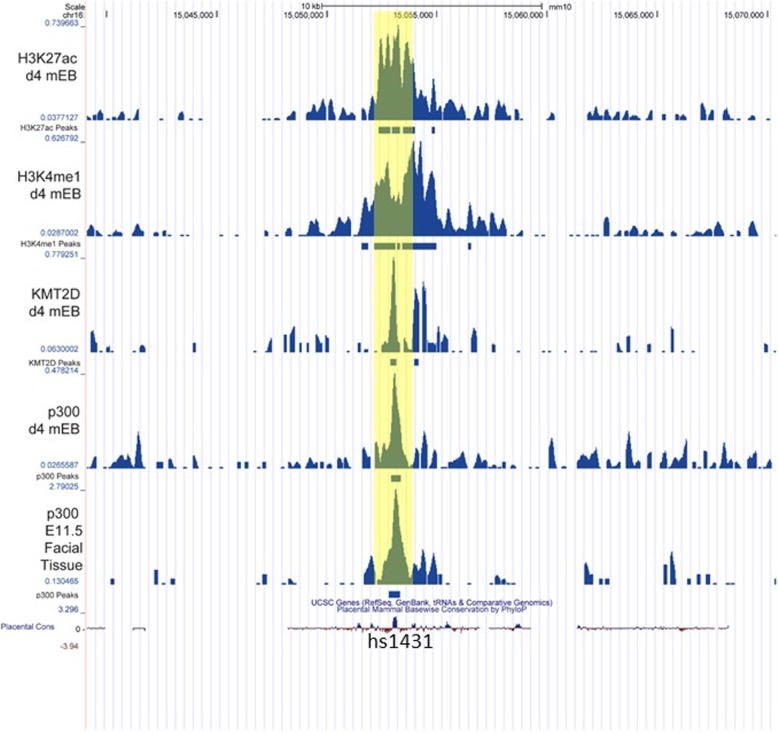
Fig. 3.
Epigenetic craniofacial enhancer analysis. Epigenetic analysis of conserved craniofacial enhancer element hs1431 shown as Genome Browser tracks of aligned indicated ChIP Seq signal peaks. Y-axis indicates coverage by estimated fragments normalized to millions of reads mapped generated from next generation sequencing. Experiments are from mouse 4 days old embryoid bodies (MLL3−/−;MLL4flox/flox) [48] and e11.5 embryonic mouse facial tissu e[128]. Data analyzed are publically available from Gene Expression Omnibus database (accession numbers GSE50534 and GSE49413). Data analysis, peak calling, and visualization were performed in BioWardrobe [130] with GRCm38/mm10 genome build

