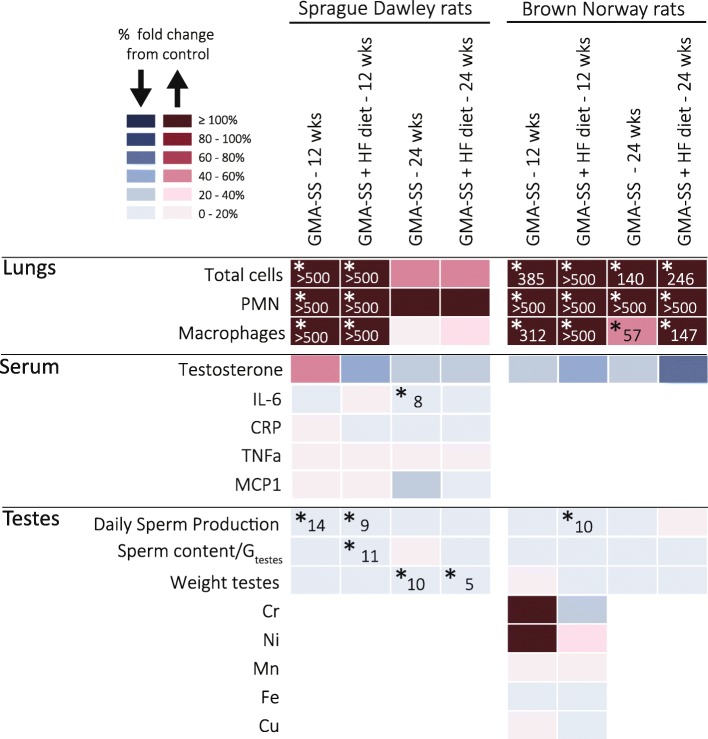
Fig. 2.
Summary of results for Sprague Dawley and Brown Norway rats fed regular or HF diet, at week 12 and 24. Color change indicates % change from Air+Reg diet calculated as (B-A)/A*100 (A = control & B = exposure). Blue color indicates decrease and red indicates increase from Air+Reg diet. Statistically significant results are indicated by the level of significance and % change from Air+Reg diet (*p < 0.05)

