Fig. 2.
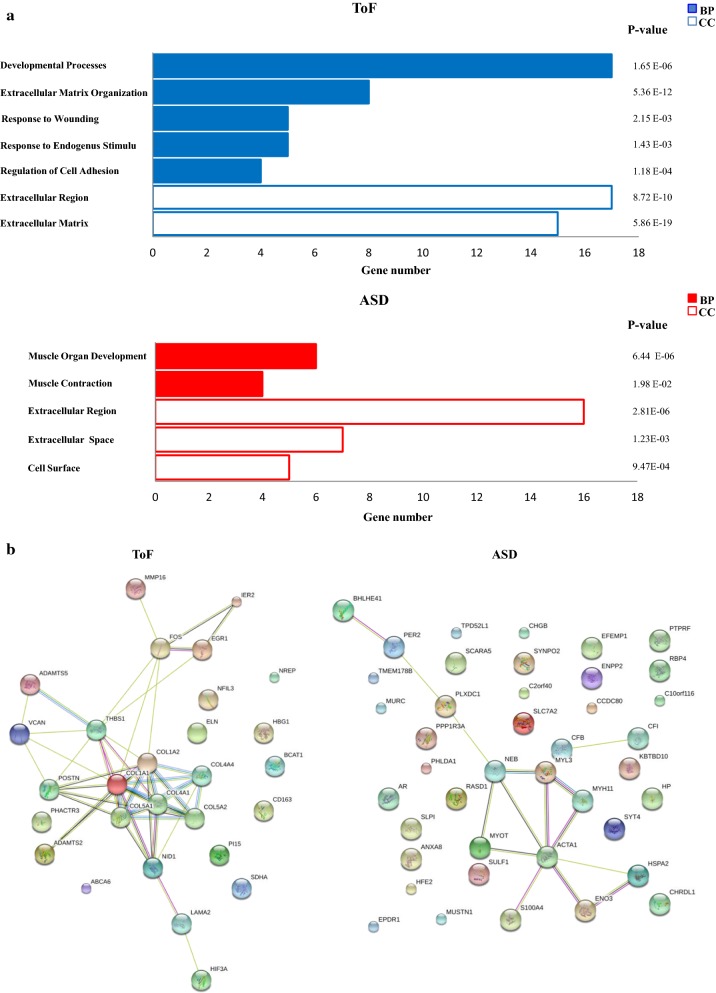
Functional enrichment and network analyses of DEGs in ToF vs ASD samples. a GO enrichment analysis. Genes showing at least twofold expression differences between ToF and ADS specimens were analyzed using the GO biological process (BP, full columns) and cellular component (CC, empty columns) collections. A GO term was significantly enriched if p-value ≤ 0.05 and FDR ≤ 0.05. Genes could be comprised in more than one term depending on the function of the encoded protein. The graph shows the most relevant GO terms. The GO term name is reported on the y-axis; the number of enriched DEGs for each term is indicated on the x-axis. GO terms are listed by decreasing number of DEGs. The p value for each GO term is indicated. b Network analysis. The STRING-DB software was used to construct functional interaction networks among DEGs products. Networks are displayed graphically as nodes (DEGs products) and edges (predicted protein–protein associations). Colored nodes indicate query DEGs and first shell of interactors. Filled nodes indicate some 3D structure known or predicted. The color of the edge indicates the type of interaction inferred by experimental evidence (magenta lines), text-mining (light green lines), curated databases (cyan lines), encoded-protein homology (purple lines), and co-expression (violet lines). The thickness of the line indicates the degree of confidence prediction of the association. Only associations with a high degree of confidence (0.7) are displayed in the plot

