Fig. 3.
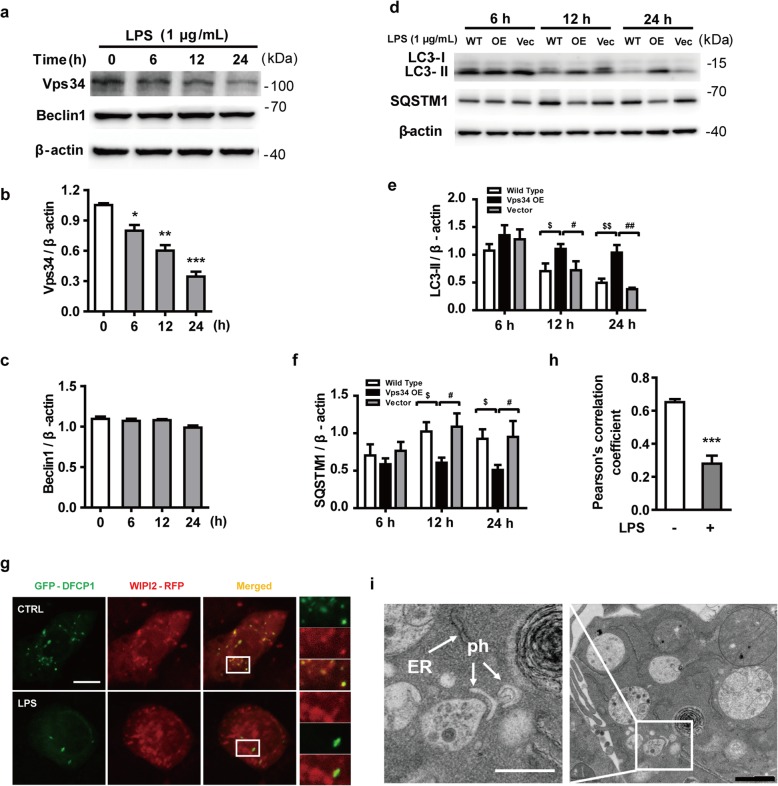
LPS reduces the expression of Vps34, resulting in the inhibition of omegasome formation and phagophore formation in N9 microglial cells. a The protein levels of Vps34 and Beclin1 were detected by western blotting in LPS-treated N9 microglial cells and quantified (b, c). d The expression of LC3 and SQSTM1 were detected by western blotting in Vps34 overexpressing N9 microglial cells after treatment with 1 μg/mL LPS for 6 h, 12 h, and 24 h, and quantified (e, f). g N9 microglial cells were transfected with GFP-DFCP1 and RFP-WIPI2 plasmids for 24 h and then treated with or without 1 μg/mL LPS for 12 h, and visualized by confocal microscopy. Immunofluorescence images show the colocalization of DFCP1 (green) with WIPI2 (red) in the CTRL and LPS-treated cells. The boxed areas are enlarged in the right panels. Scale bar: 10 μm. h Pearson’s correlation coefficient for colocalization of DFCP1 with WIPI2 was calculated by Image J. Data are presented as mean ± SEM of three independent experiments. i Representative TEM images of N9 microglial cells cotreated with 100 nM rapamycin and 1 μg/mL LPS for 12 h. Arrows indicate phagophores (ph) and endoplasmic reticulum (ER). Scale bar: 500 nm (white), 1 μm (black). Data are presented as mean ± SEM. *p < 0.05, **p < 0.01, ***p < 0.001 vs control; $p < 0.05, $$p < 0.01 vs wild type; #p < 0.05, ## p < 0.01 vs vector

