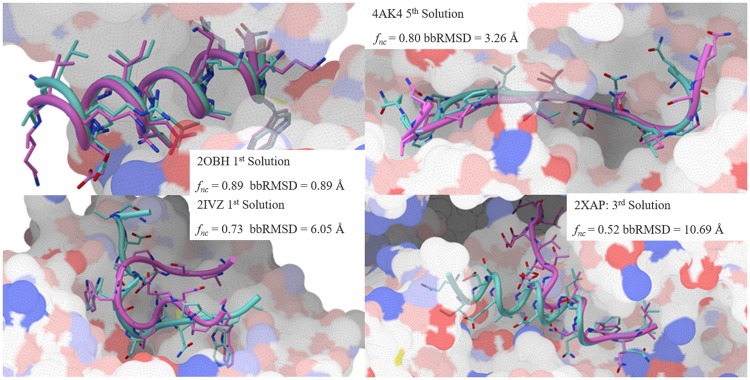
Fig. 4.
Comparison of selected docked poses (cyan) and experimentally determined structures (magenta). The receptor surface is provided for context and colored using a polarity scheme developed by Dr. D. Goodsell. These Figures are generated using PMV 1.5.7 (Sanner, 1999) and MSMS (Sanner et al., 1996) (Color version of this figure is available at Bioinformatics online.)

