
Fig. 1.
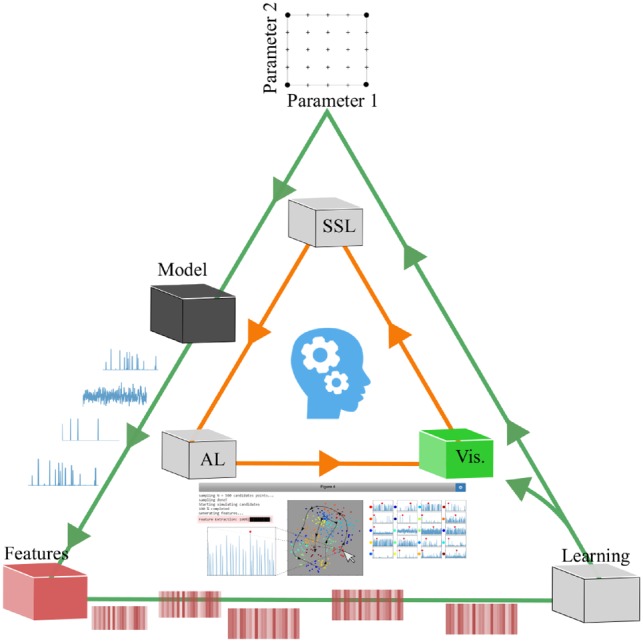
Smart Exploration workflow. The workflow starts with the user defining a parameter experimental design (top) to build a first batch of different parameter settings. Each parameter point is then realized in the model and corresponding simulator (black), which will output the trajectories for each realization. The raw trajectories (time series) are then converted to feature arrays (red) based on time series analysis. The data from the sweep will then enter a learning cycle (white), where the modeler will be able to visualize and interact with the data points (which corresponds to a parameter point) in a reduced 2D or 3D feature space using a dimension reduction method where points in proximity to each other are assumed to have similar qualitative behavioral properties. Clicking on the scatter points will show the raw simulation output trajectory of a user specified molecular species (green). While exploring, the modeler can give feedback to the system by labeling data points. Only a few labeled data points are needed since the data will then be fed into a semi-supervised learning algorithm (SSL). Using the semi-supervised model to infer labels of unlabeled data points, the system will also be able to evaluate the label uncertainty. This uncertainty can be used by active learning (AL) to ultimately suggest data points that the modeler might not yet have discovered or to simply improve the semi-supervised model. Once the modeler is satisfied with the current labeling of data points the experimental design can be fine-tuned to include new parameter points, e.g. zoom in on ROIs of points according to the predictions of the semi-supervised model