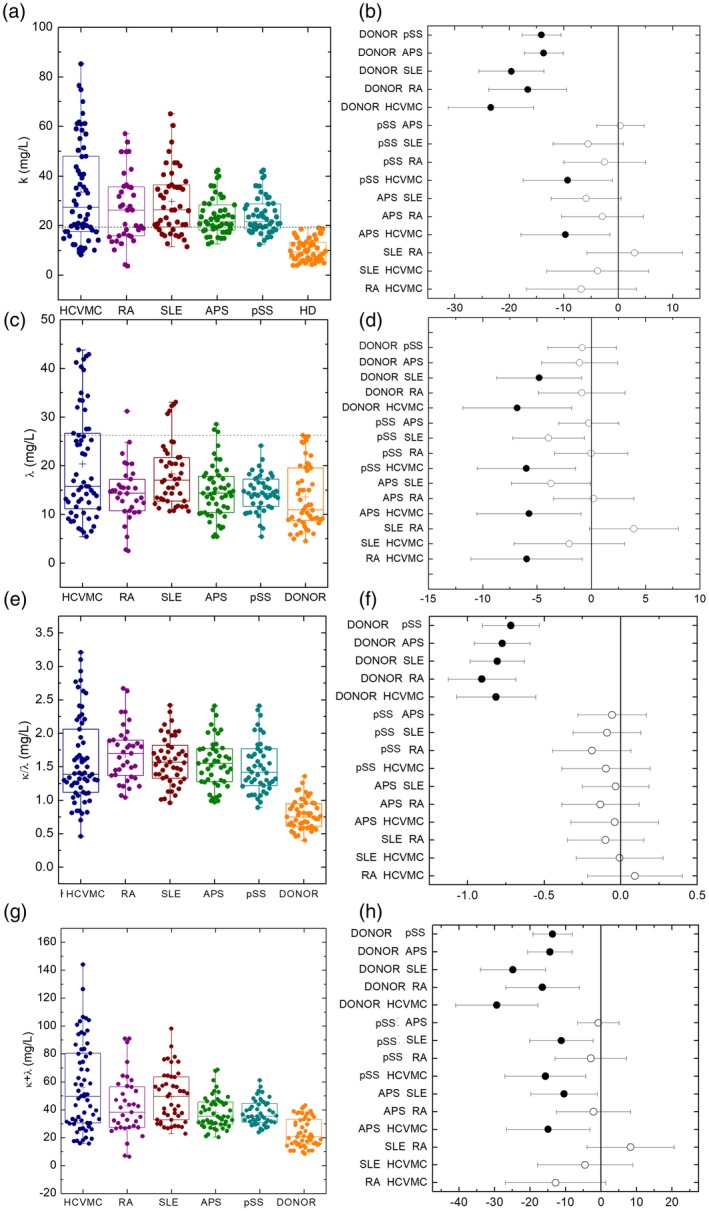
Figure 1.

Free light chain (FLC) levels in patients and controls. (a) The κ levels in different patient subgroups and controls. (b) Comparison of κ levels among the various patient subgroups and controls. (c) The λ levels in different patient subgroups and controls. (d) Comparison of λ levels between the various patient subgroups and controls. (e) The κ/λ levels in different patient subgroups and controls. (f) Comparison of κ/λ levels among the various patient subgroups and controls. (g) The κ + λ levels in different patient subgroups and controls. (h) Comparison of κ + λ levels between the various patient subgroups and controls.
