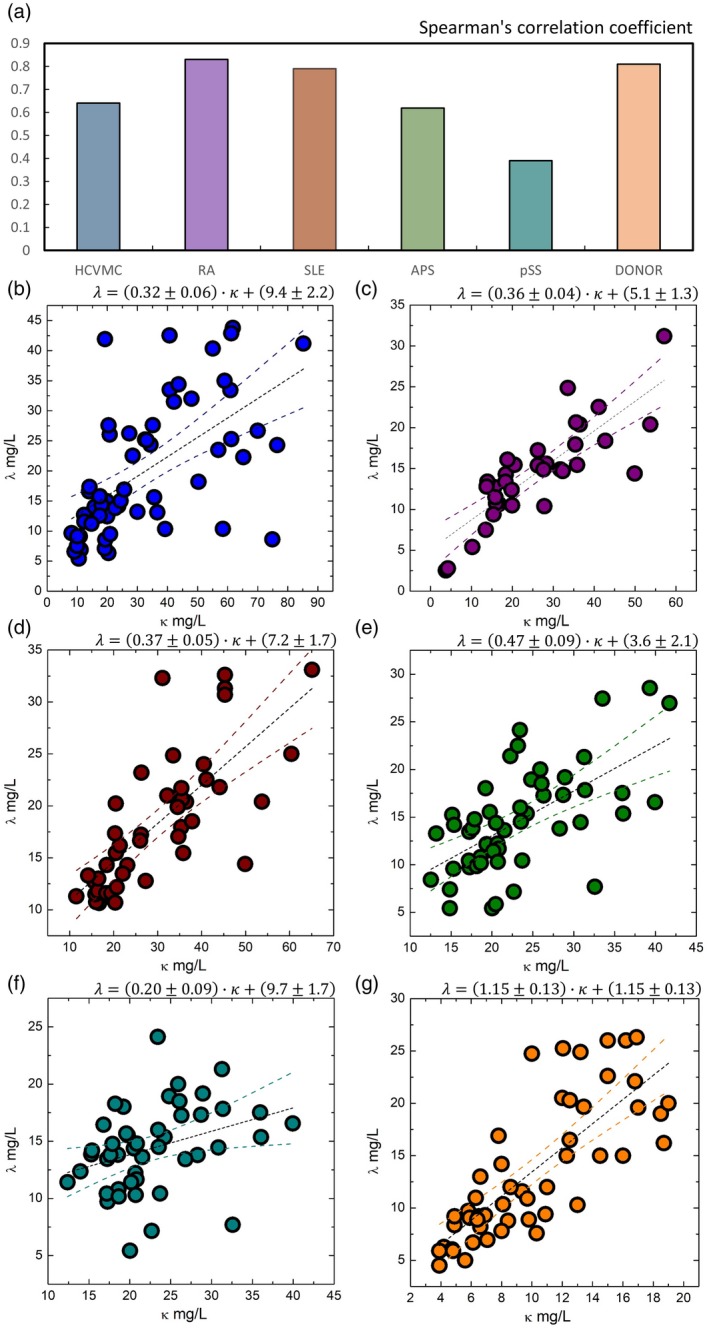
Figure 2.

Free light chain distribution between different patient subgroups and controls. (a) Correlation between κ and λ levels in patient subgroups. (b) The λ levels as a function of κ levels for patients with hepatitis C virus‐related mixed cryoglobulinaemia (HCVMC). (c) The λ levels as a function of κ levels for rheumatoid arthritis (RA) patients. (d) The λ levels as a function of κ levels for systemic lupus erythematosus (SLE) patients. (e) The λ levels as a function of κ levels for anti‐phospholipid syndrome (APS) patients. (f) The λ levels as a function of κ levels for primary Sjogren's syndrome (pSS) patients. (g) The λ levels as a function of κ levels for healthy blood donors.
