
Figure 1.
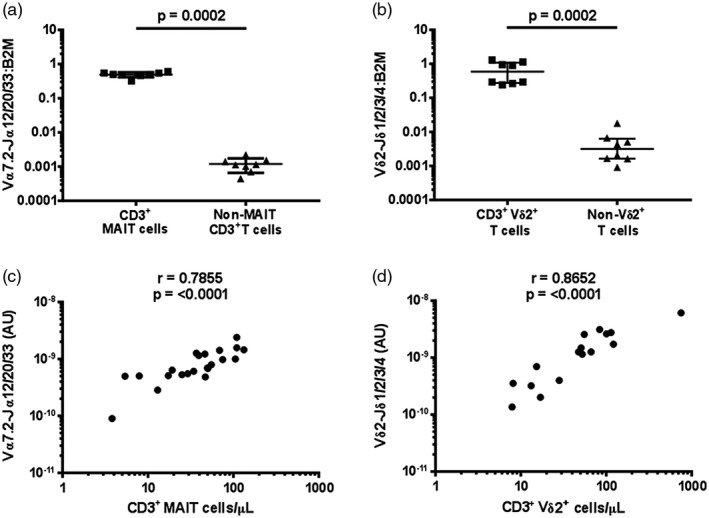
Validation of the quantitative polymerase chain reaction (qPCR) method to determine mucosal‐associated invariant T (MAIT) cell and Vδ2+ T cell abundance. The specificity of the qPCR assay was determined by measuring the abundance of (a) Vα7.2‐Jα12/20/33 gDNA in MAIT cells (live/CD3+/CD161++/Vα7.2+) and non‐MAIT CD3+ T cells (live/CD3+/CD161–/Vα7.2–) (n = 5) and (b) Vδ2‐Jδ1/2/3/4 gDNA in Vδ2+ cells (live/CD3+/Vδ2+) and Vδ2– CD3+ T cells (live/CD3+/Vδ2–) (n = 8), each sorted from peripheral blood mononuclear cells (PBMCs) and abundance expressed relative to β2 microglobulin (β2M) in arbitrary units. Correlation between the abundance of (c) MAIT (n = 22) and (d) Vδ2+ T cells (n = 16) in whole PBMC samples measured by qPCR and by flow cytometry; the absolute copy number of β2M was calculated with LinRegPCR 23 and the number of MAIT cells (Vα7.2‐Jα12/20/33 gDNA) and Vδ2+ T cells (Vδ2‐Jδ1/2/3/4 gDNA) determined relative to β2M and expressed in arbitrary units. In (a) and (b), individual data points representing the mean of technical triplicates of the qPCR assay, the median and interquartile ranges are shown; differences between groups were analysed by Mann–Whitney tests; (c) and (d) were analysed using Spearman correlations. **P < 0·01, ***P < 0·001 (Mann–Whitney test).