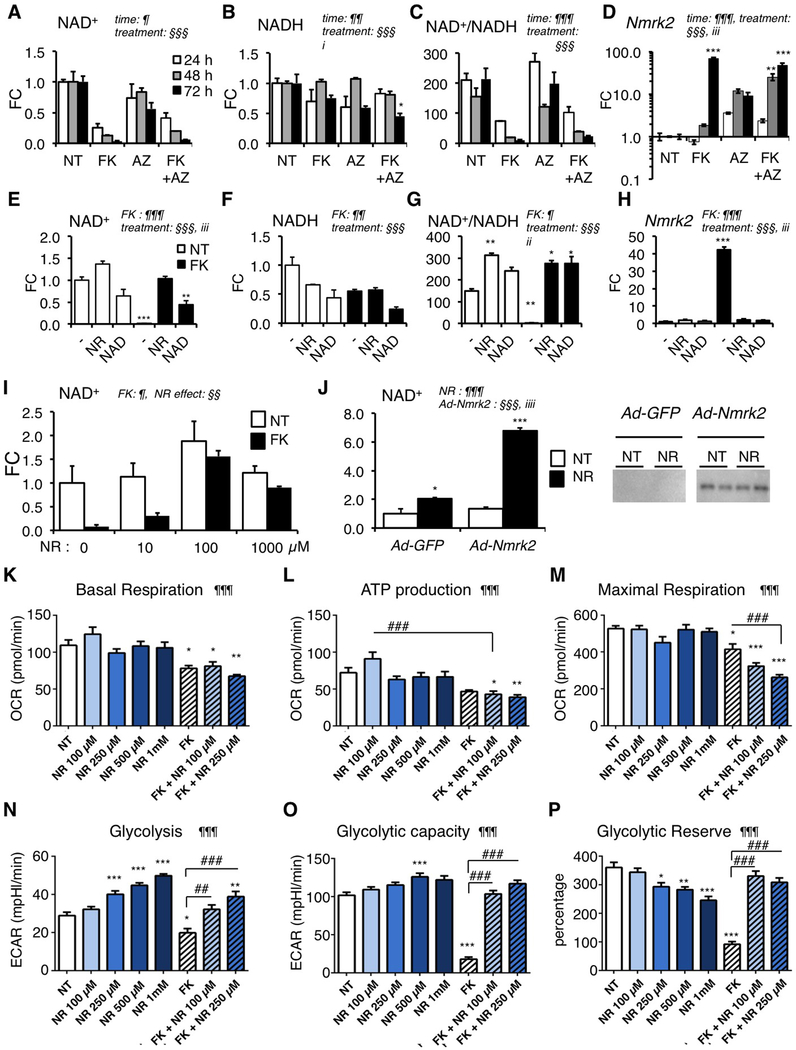
Figure 4. Nmrk2 expression is activated by repression of alternative NAD+ biosynthetic pathways.
(A-C) Intracellular levels of NAD+ (A), NADH (B) and NAD+/NADH ratio (C) in NRC after 10 μM FK866 and/or 20 μM Azaserin treatment or no treatment (NT) for 24 h to 72 h as indicated.
(D) Nmrk2 mRNA level in NRC treated as in (A-C)
(E-G) Same as in (A-C) in NRC treated for 72h with 10 μM FK866 or not treated (NT) in normal culture medium (−) or in presence of 250 μM NAD+ or 1 mM NR.
(H) Nmrk2 mRNA level in NRC treated as in (E-G)
(I) NAD+ levels in NRCs treated with 10 μM FK866 for 72 h, or not treated (NT) in the presence of increasing concentration of NR in culture medium.
(J) NAD+ content in non-treated (NT) or following 24 h NR treatment (1mM) in NRC infected with Ad-GFP or HA-Nmrk2. Bottom: western blot detection of HA-Nmrk2 with anti-HA antibody.
(K-M) Mitochondrial stress test in Seahorse analyzer. NRC grown on Seahorse 96 well plates were analyzed for oxygen consumption rate (OCR) at day 8 after 5 days of treatment. (K) Basal mitochondrial respiration is calculated from total cellular respiration minus non-mitochondrial respiration. (L) ATP production is calculated from basal mitochondrial respiration minus respiration after oligomycin injection. (M) Maximal respiration is measured after FCCP injection. See accompanying Suppl. Figure S9 for other respiration parameters.
(N-P) Glycolysis stress test in Seahorse analyzer. NRC grown on Seahorse 96 well plates were analyzed at day 8 after 5 days of treatment. (N) Glycolysis was measured as a function of extracellular acidification rate (ECAR) after injection of glucose 10 mM. (O) Glycolytic capacity as the maximum ECAR following injection of oligomycin. (P) Glycolytic reserve as the difference between glycolysis and maximal glycolytic capacity.
Throughout the figure the data are expressed as mean fold change (FC) ± SEM over the control group, except when indicated. Statistical analysis: a two-way factorial ANOVA for independent samples was used for panels A to J. ¶ and § symbols as indicated in the panels; i p≤0.05, ii p≤ 0.01, iii p≤0.001 for the interaction effect. One-Way ANOVA was used for panels K-P: ¶ p< 0.05, ¶¶ p< 0.01, ¶¶¶ p< 0.001. Tukey test: *, p< 0.05, ** p< 0.01, *** p< 0.001 between any group versus NT control cells; ## p< 0.01, ### p< 0.001 for indicated comparisons.

