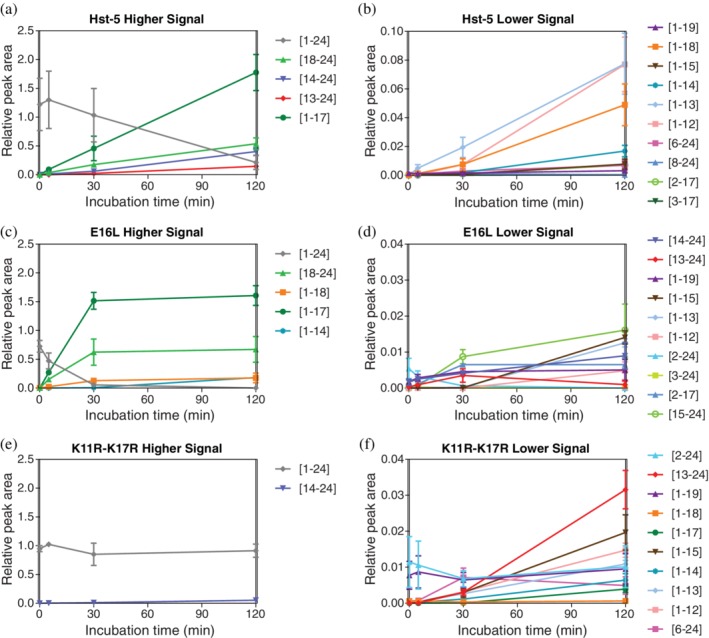
Figure 4.

Kinetics of degradation of (a,b) Hst‐5, (c,d) E16L, and (e,f) K11R–K17R by Sap9. Degradation products with higher signals are shown in (a), (c), and (e), while those with lower signals are shown in (b), (d), and (f). Hst‐5 and the variants (50 μM) were incubated with 3 μg/ml Sap9 for 0, 5, 30, and 120 min. Data are shown as the average relative peak area, which was obtained from the electrophoretogram of the sample mass spectra relative to an internal standard. Fragments that showed a relative peak area > .001 for at least one of the time points are displayed. Errors are the standard error of the mean (n = 3)
