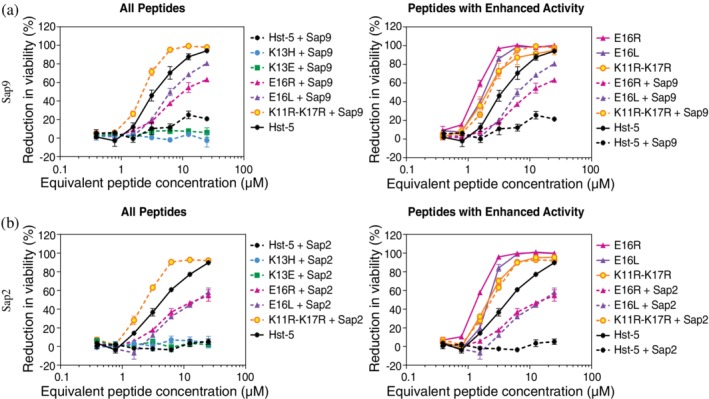
Figure 6.

Antifungal activity of the peptides after incubation with or without (a) Sap9 or (b) Sap2. The peptides (50 μM) were incubated with Sap9 (6 μg/ml), Sap2 (0.2 μg/ml), or 1 mM NaPB buffer. The peptides were then serially diluted and incubated with 2.5 × 10⁵ cells/ml C. albicans prior to analyzing viability. For each Sap, the left plot shows activity of Hst‐5 and all variants after exposure to Saps. The right plot compares the activity of Hst‐5 and peptides that showed enhanced activity (E16R, E16L, K11R–K17R) before and after incubation with Saps. The error bars indicate the standard error of the mean (n = 4)
