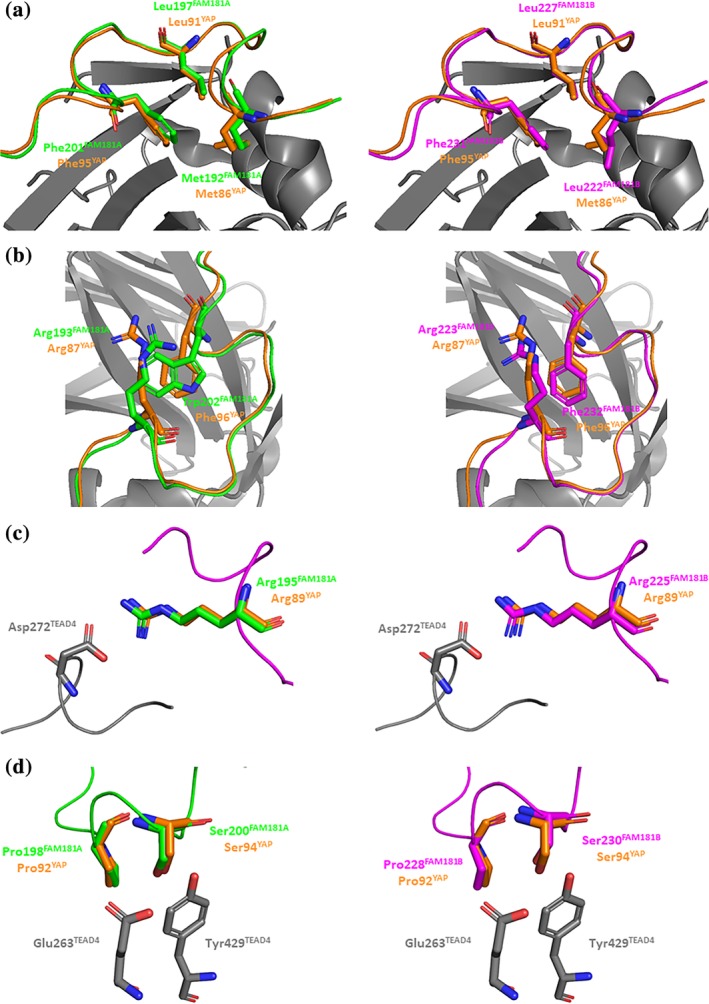
Figure 4.

Key interactions between FAM181A190–205/FAM181B220–235 and TEAD4. Left panels. The structures of the FAM181A190–205:TEAD4 (pdb http://bioinformatics.org/firstglance/fgij//fg.htm?mol=6SEN) and YAP60–100:TEAD4 (pdb http://bioinformatics.org/firstglance/fgij//fg.htm?mol=6GE3 26) complexes have been superimposed. The residues of FAM181A, YAP and TEAD are represented by green, orange and gray sticks, respectively. Right panels. The structures of the FAM181B220–235:TEAD4 complexes (pdb http://bioinformatics.org/firstglance/fgij//fg.htm?mol=6SEO) and YAP60–100:TEAD4 (pdb http://bioinformatics.org/firstglance/fgij//fg.htm?mol=6GE3 26) complexes have been superimposed. The residues of FAM181B, YAP and TEAD are represented by magenta, orange and gray sticks, respectively. (a). Hydrophobic core of the Ω‐loop. (b). Residues involved in the stabilization of the hydrophobic core. (c). Salt bridge with Asp272TEAD4. (d). Hydrogen bonds with Glu263TEAD4:Tyr429TEAD4 and position of the conserved proline at the binding interface. The picture was drawn with PyMOL (Schrödinger Inc., Cambridge, Massachusetts)
