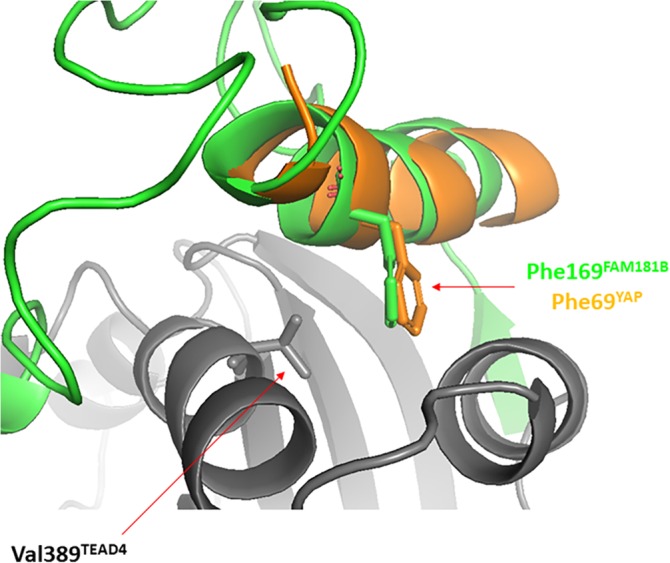
Figure 5.

Interaction between the LxxLF motif and TEAD. A simulation of molecular dynamics was run using the FAM181B154–236:TEAD217–434 complex (see text for details). The figure represents a superimposition between the conformation obtained after 10 ns simulation and the structure of the YAP:TEAD complex (PDB http://bioinformatics.org/firstglance/fgij//fg.htm?mol=3KYS 16). FAM181B154–236 and TEAD217–434 and colored in green and gray, respectively. The YAP61–74 region from the YAP:TEAD structure is represented in orange. The picture was drawn with PyMOL (Schrödinger Inc., Cambridge, Massachusetts)
