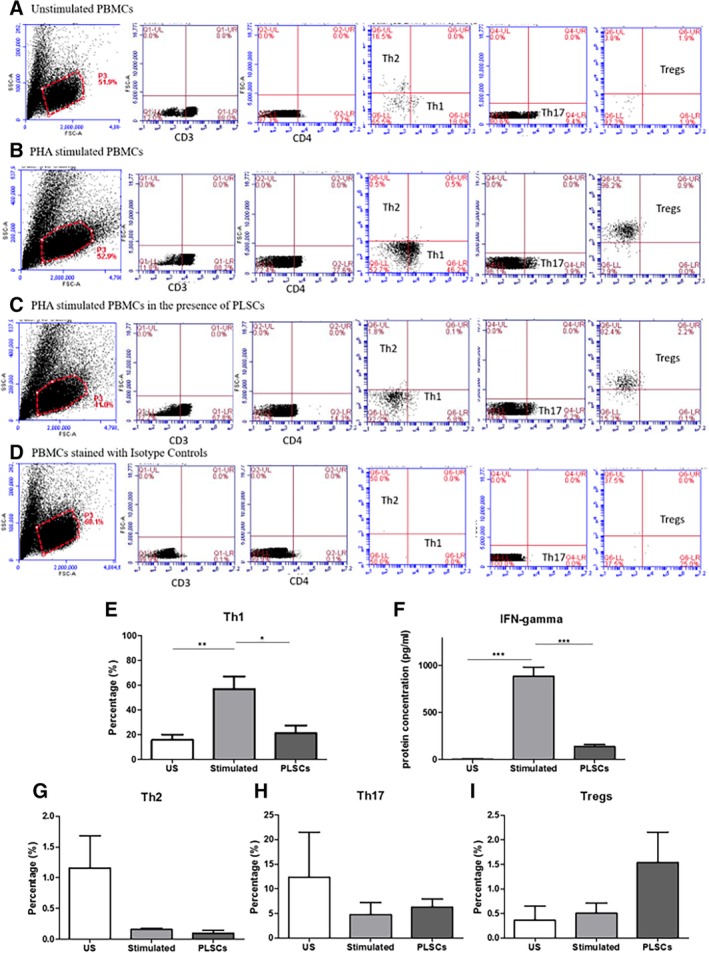
Figure 5.

Flow cytometry analysis of CD3+ CD4+ subsets at baseline (unstimulated), following stimulation with phytohemagglutinin (PHA) in the presence and/or absence of placenta‐derived cells (PLSCs). A, Panel showing gating strategy used for analysis of unstimulated peripheral blood mononuclear cells (PBMCs); B, panel showing the gating strategy used for analysis of PHA stimulated PBMCs; C, panel showing the gating strategy used for analysis of PHA stimulated PBMCs in the presence of PLSCs; D, panel showing the gating strategy used for analysis of isotype controls; E, Th1 percentage (%); F, IFN‐γ secreted levels measured in the culture medium; G, Th2 percentage (%); H, Th17 percentage (%); and I, Tregs percentage (%). Bars represent SEM. *P < .05; **P < .01; ***P < .001
