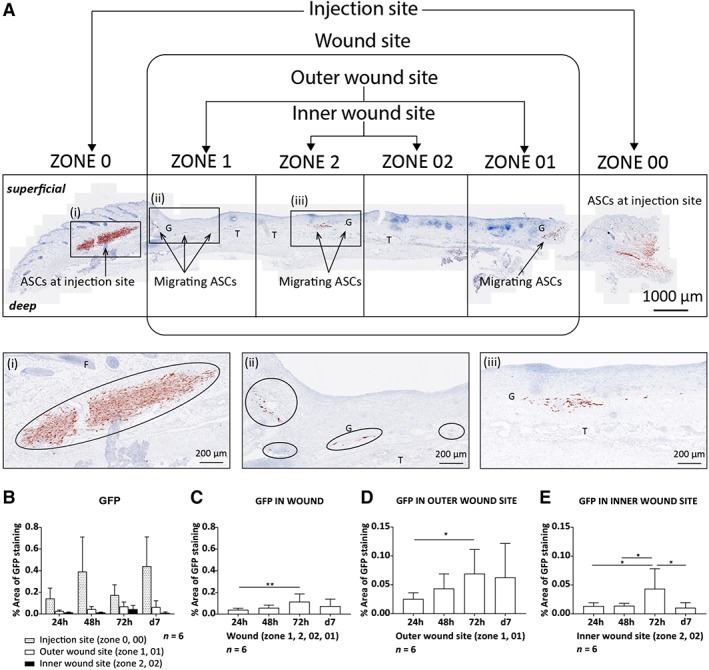
Figure 6.

Locally administered ASCs were detected within the wound over time. A total of 2 × 10⁵ ASCs transduced to express both Fluc and GFP were injected locally into two sides around each wound 24 hours after bilateral full‐thickness wounds had been created on the dorsal part of the feet. A, a single tissue section from the wound in the feet 24 hours post injection stained for GFP (red staining, AEC). Magnified images of the (i) injection site, (ii) outer wound site, and (iii) inner wound site. The distribution of ASCs at the different sites of the wound was quantified over time showing, B, The injection site, outer, and inner wound site in a single graph, C, the wound site (zone 1, 2, 02, 01), D, the outer wound site (zone 1, 01), and, E, the inner wound site (zone 2, 02). Data shown as mean ± SD. Significance is shown where *P < .05; **P < .01. Abbreviations: AEC, aminoethyl carbazole; ASCs, adipose‐derived mesenchymal stromal cells; E, epithelium; F, hair follicles; Fluc, firefly luciferase; G, granulation tissue; GFP, green fluorescent protein; T, tendons
