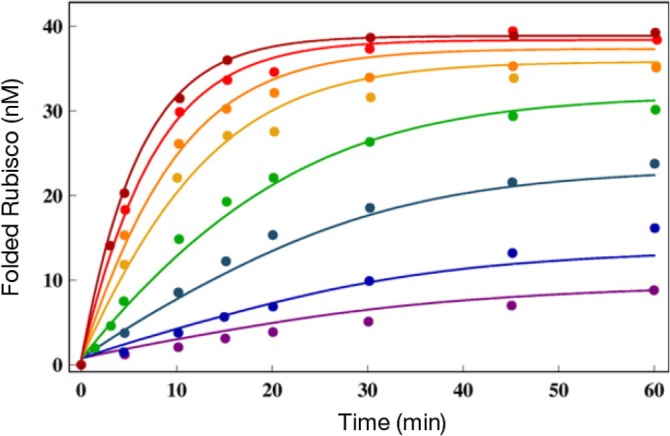
Figure 6.

Native‐state yield of ribulose bisphosphate carboxylase oxygenase (RUBISCO) as a function of time at different GroEL concentrations. The chaperonin concentrations for the curves from bottom to top are 1, 2, 5, 10, 20, 30, 50, and 100 nM. The lines are the fits to the experimental data from Reference 14 using the kinetic model. The figure was adapted from Reference 75
