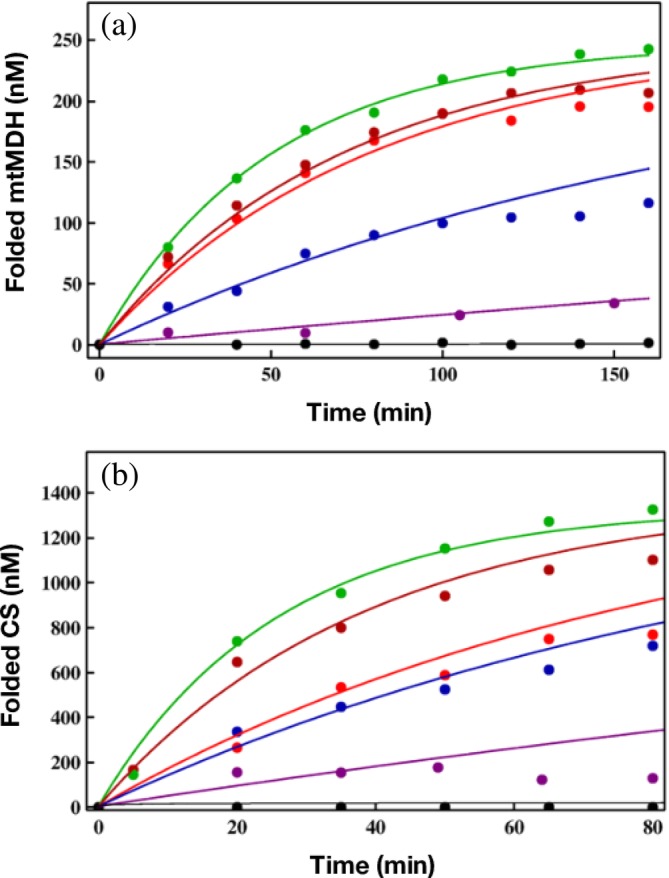
Figure 7.

Yield of SPs as a function of time. (a) The data points are taken from the experiment for folding of mitochondrial malate dehydrogenase (mtMDH). The lines are the fits using the kinetic model developed in Reference 75. The black line is for spontaneous folding. Assisted folding in the presence of GroES and GroEL mutant SR1 (purple), Single Ring 1, SR1 mutants, SR‐T522I (blue), SR‐A399T (red), and SR‐D115N (dark red), was used to assess the efficiencies of these three single‐ring chaperonins relative to GroEL (green). (b) The same as (a) except the SP is citrate synthase (CS)
