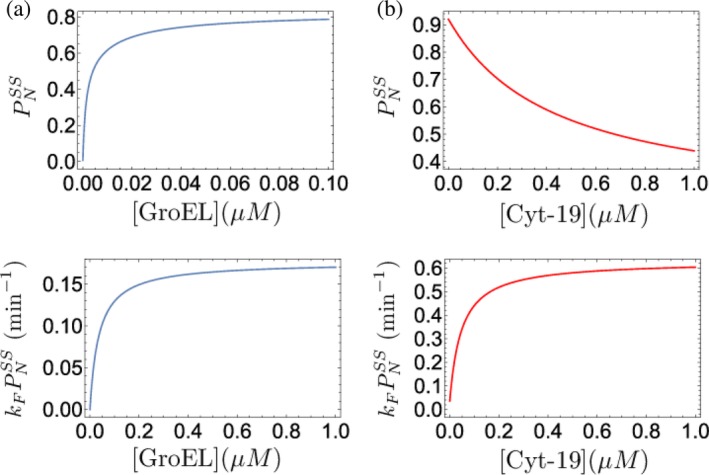
Figure 11.

Maximization of the finite‐time yield by iterative annealing. (a) GroEL and (b) Cyt‐19. (Top panels) Steady‐state yield of the folded ribulose bisphosphate carboxylase oxygenase (RUBISCO) (a) and ribozyme (b), as a function of chaperone concentration. (Bottom panels) Yield per unit time for RUBISCO (a) and ribozyme (b), as a chaperone concentration. For all of the curves, ATP concentration was set to 1 mM. The figure was adapted from Reference 50
