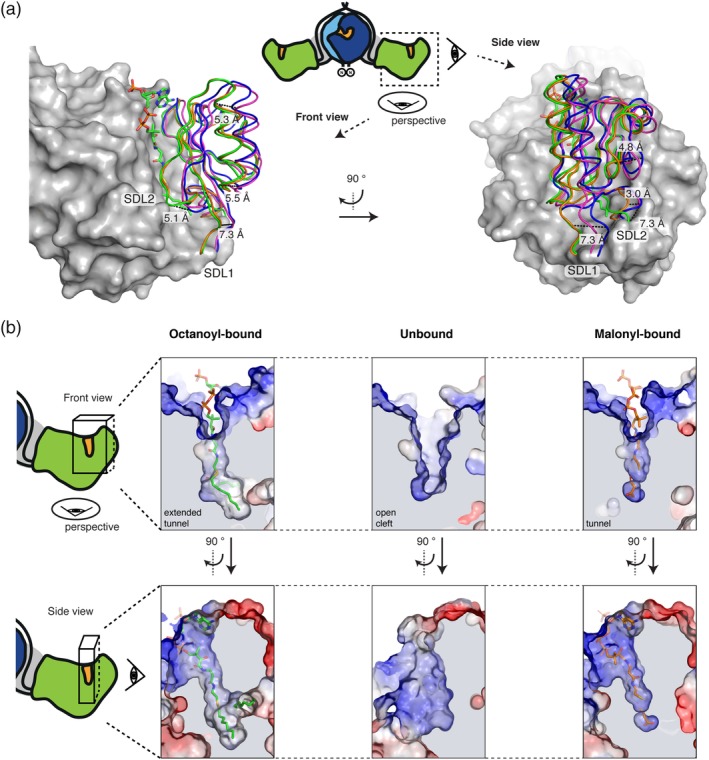
Figure 3.

Conformational variability of the MAT active site. (a) α/β‐Hydrolase fold centered superposition (BB of residues 488–613 and 685–806) of four MAT domains in different acyl‐bound states. chain A (blue) and chain D (green) from the octanoyl‐CoA soaked crystal (PDB code: http://firstglance.jmol.org/fg.htm?mol=6rop), malonyl‐bound (orange) (PDB code: http://firstglance.jmol.org/fg.htm?mol=5my0; chain D) and apo human MAT (purple) (PDB code: http://firstglance.jmol.org/fg.htm?mol=3hhd; chain A) were used. The α/β‐hydrolase subdomain is shown in surface depiction and the ferredoxin‐like fold in cartoon loops. Selected distances between corresponding residues indicate the mobility of the subdomains with a relative movement of the ferredoxin‐like fold of up to 7.3 Å. (b) Different active site and entry tunnel shapes upon substrate binding. Surface depictions of active sites of chain D (left panel) and A (middle) from the octanoyl‐bound structure and chain D (right panel) from the malonyl‐bound structure are shown in two perspectives. Surfaces are shown in surface electrostatic representation calculated with PyMOL and shown in default coloring with positive potential depicted in blue and negative potential in red. Views as in (a). BB, backbone atoms; MAT, malonyl‐/acetyltransferase
