
Figure 1.
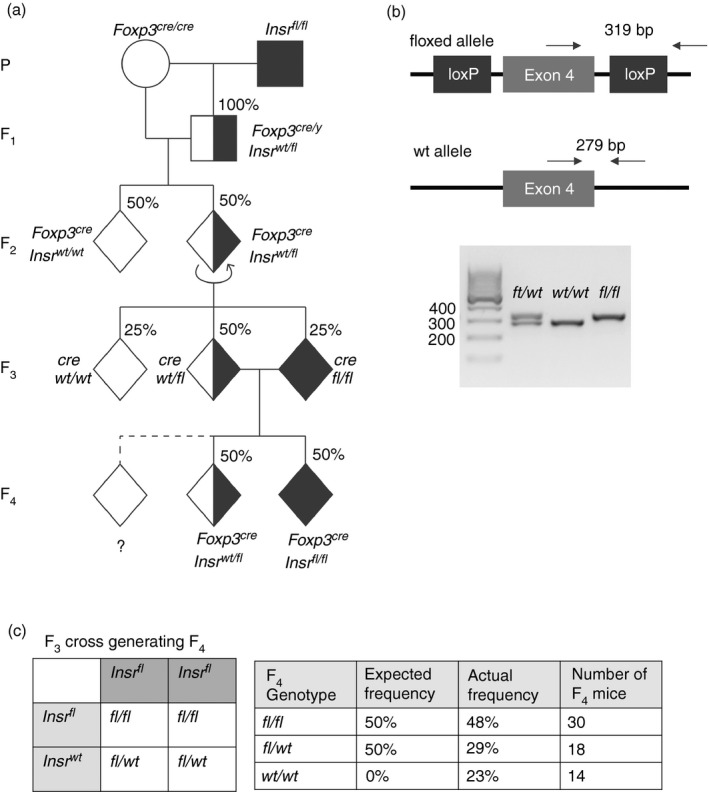
Unexpected offspring genotype ratio during the breeding of Foxp3YFP‐Cre to Insrfl/fl mice. (a) Breeding scheme to generate Foxp3YFP‐CreInsrfl/fl mice and Foxp3YFP‐CreInsrfl/wt littermate controls, with expected genotype ratios. Circles represent females, squares represent males, and diamonds represent mice of either sex; shading indicates the expected number of Insrfl alleles. The dashed line indicates progeny in the F4‐generation with an unexpected genotype. (b) Depiction of the conventional two‐band genotyping PCR strategy, in which primers flanking the loxP site that is 3′ of Insr exon 4 amplify different PCR products depending on the presence of a floxed or a wild‐type allele (top). Representative PCR products are resolved on a 2% agarose gel, with each lane representing one mouse (bottom). (c) Punnett square showing the expected F4‐generation genotype ratio from Foxp3YFP‐CreInsrfl/fl mice and Foxp3YFP‐CreInsrfl/wt parents (left). Table compares expected and actual F3 offspring ratios (right). n = 62 in the F4 generation.