
Figure 5.
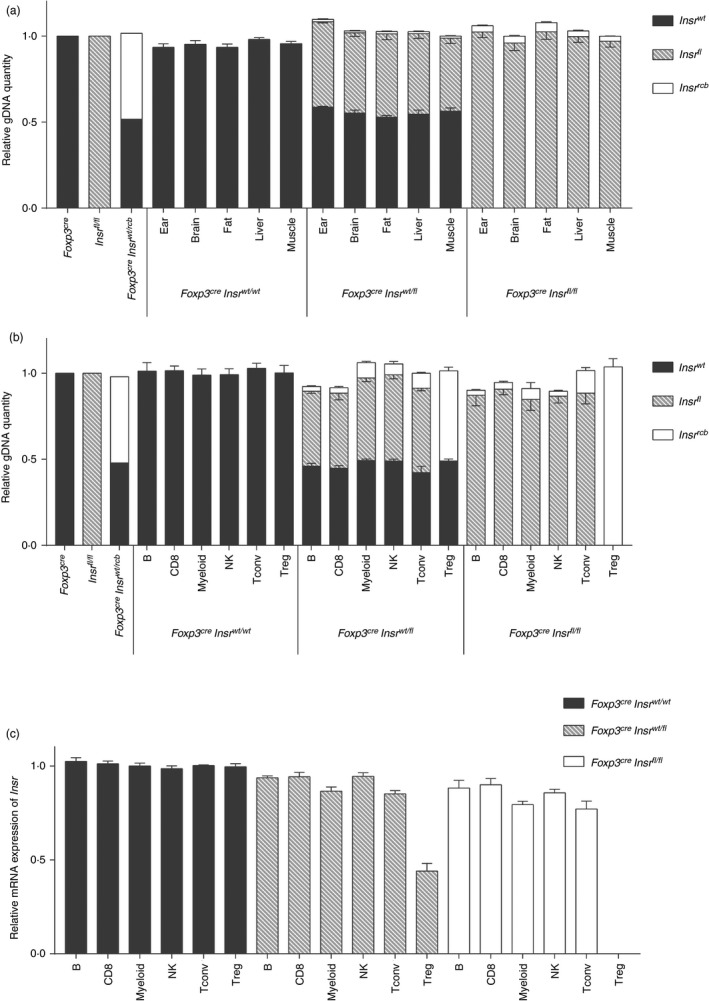
Quantification of ectopic recombination across metabolic tissues and immune cell types. (a,b) Quantitative PCR was performed using three pairs of allele‐specific primers on the gDNA obtained from (a) ear, brain, fat, liver and muscle tissue lysates and (b) Sorted B cells, CD8+ T cells, myeloid cells, natural killer (NK) cells, conventional T (Tconv) cells and regulatory T (Treg) cells. Data were normalized to the gDNA from ear‐tissue lysates of a Foxp3YFP‐Cre mouse, an Insrfl/fl mouse, or a Foxp3YFP‐CreInsrwt/rcb mouse. Error bars represent standard errors (n = 4 per genotype). (c) Insr mRNA expression by qPCR with mRNA from sorted immune cells. Data were normalized within each immune cell group to those obtained from Foxp3YFP‐CreInsrwt/wt mice. Error bars represent standard errors (n = 4 per genotype).