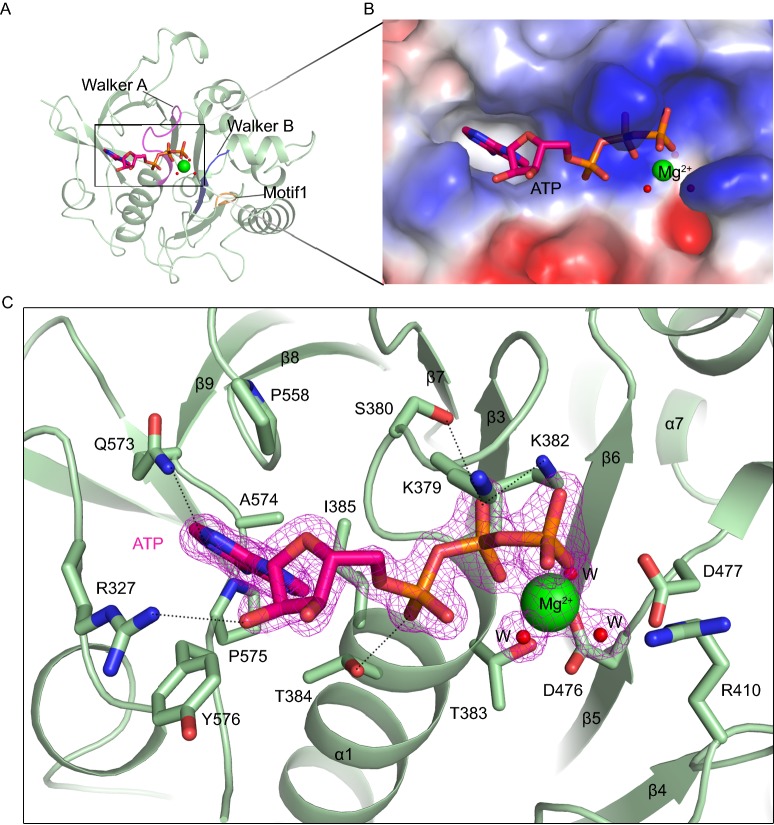
Figure 2.
The nucleotide-binding site ofMtEccC-ATPase3. (A) The location of the nucleotide-binding site in MtEccCb1-ATPase3. ATP and the magnesium ion, are shown as stick representations and as a sphere, respectively. The Walker A, Walker B and Motif 1 are colored magenta, blue and orange, respectively. (B) Close-up view of the nucleotide-binding pocket shown in electrostatic surface representation. ATP and the magnesium ion, are shown as stick representations and as a sphere, respectively. (C) Interactions between Mg2+, ATP and nearby amino acid residues. Green and red spheres represent Mg2+ and water molecules, respectively. The 2Fo-Fc density map (pink mesh) of ATP, Mg2+ and the coordinated water molecules is contoured at 1 σ. The dashed lines represent hydrogen bonds between ligands and the protein. W, water molecule

