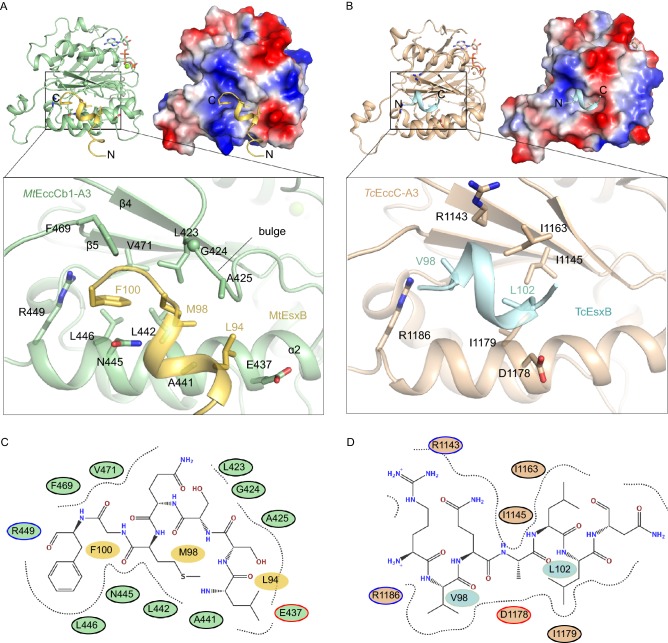
Figure 4.
Substrate-specific recognition of EccCb1-ATPase3fromMycobacterium tuberculosisand EccC-ATPase3fromThermomonospora curvata. (A) (Upper left) A cartoon image of MtEccCb1-ATPase3 (pale green) in complex with MtEsxB (yellow). (Upper right) The same complex but shown as an electrostatic surface. (Bottom image) A zoom-in view of the interactions at binding pocket. N/C, the N-/C-terminal end of peptide. (B) (Upper left) A cartoon image of TcEccC1-ATPase3 (wheat) in complex with the C-terminal region of TcEsxB (pale cyan) (PDB code: 4N1A). (Upper right) The same complex but TcEccC1-ATPase3 is shown as an electrostatic surface. (Bottom image) A zoom-in view of the interactions at binding pocket. (C) Schematic diagram of the interactions between MtEccCb1-ATPase3 and MtEsxB at the recognition pocket. (D) Schematic diagram of the interactions between TcEccC1-ATPase3 and TcEsxB at the recognition pocket

