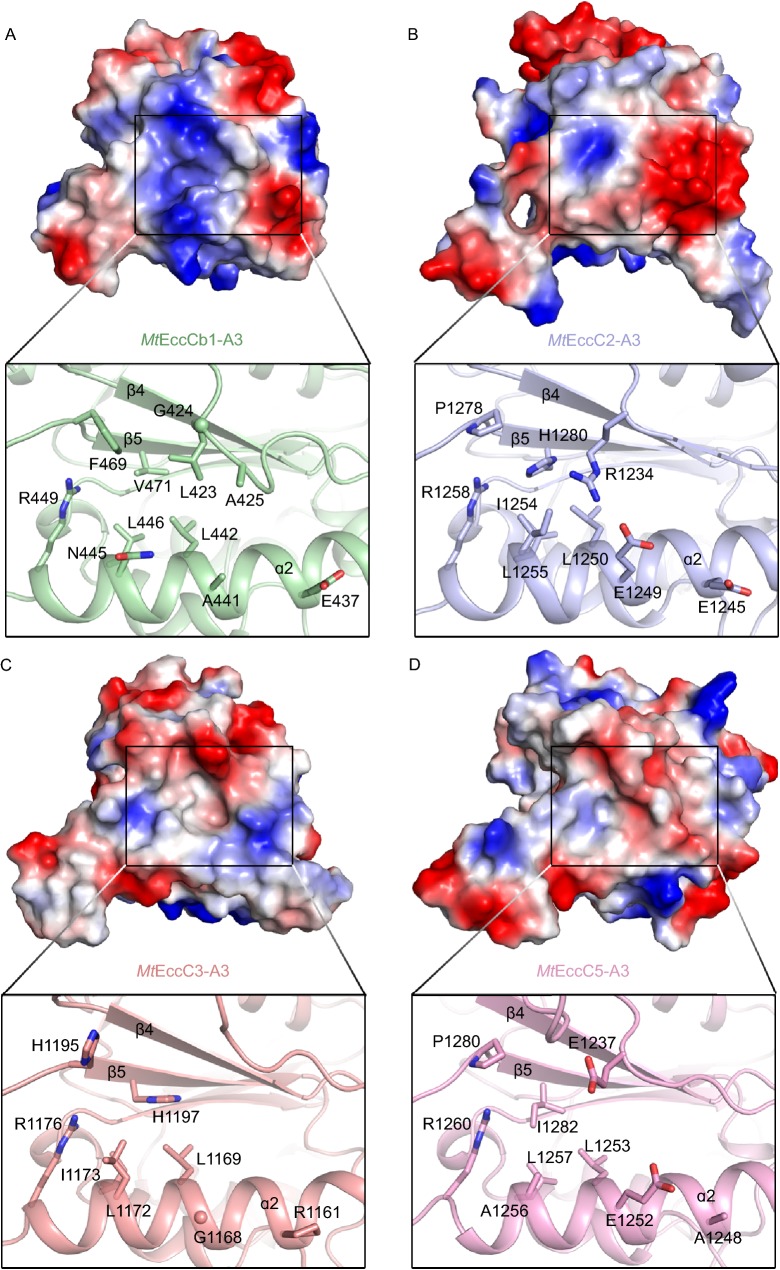
Figure 5.
Structural comparison of the signal recognition pocket of EccC-ATPase3domains. MtEccCb1-ATPase3 (A), MtEccC2-ATPase3 (B), MtEccC3-ATPase3 (C) and MtEccC5-ATPase3 (D) are drawn in electrostatic surface representation. Inserts provide a detailed view of the signal recognition pocket. Comparable to MtEccCb1-ATPase3, residues that are likely involved in substrate binding are shown as stick models

