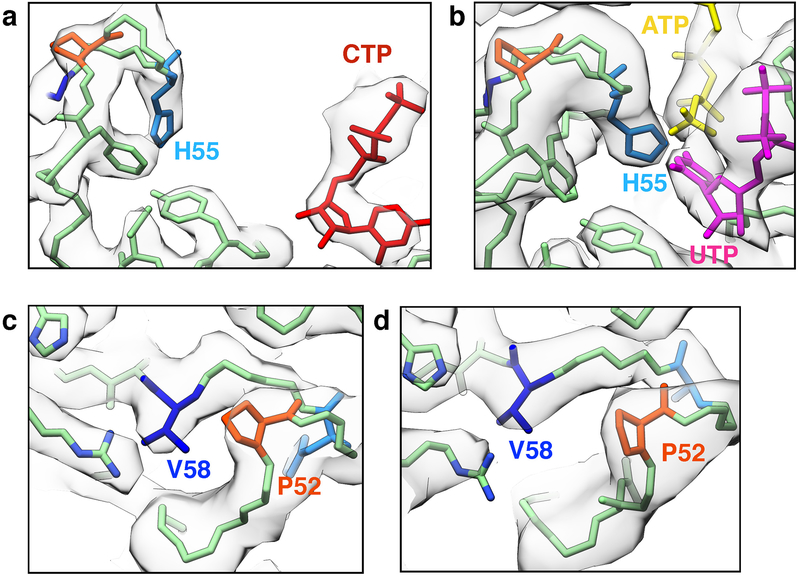
Extended Data Fig. 7. CryoEM density at the P52-V58 and H55 constriction points.
(a,b) CryoEM density (grey) and atomic models (color) at the H55 gate in the P-state (a) and S-state (b) CTPS2 filaments. (c,d) CryoEM density (grey) and atomic models (color) at the P52-V58 constriction in the P-state (c) and S-state (d) CTPS2 filaments.

