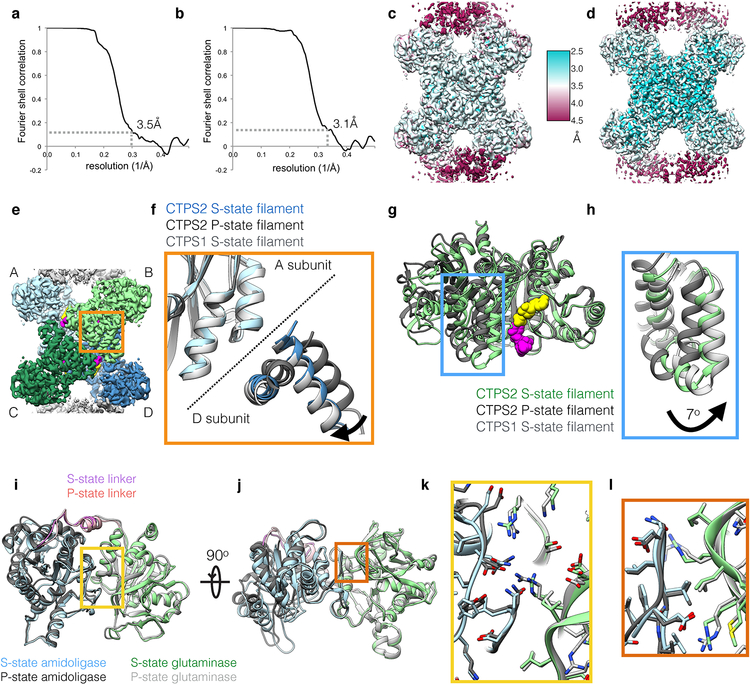
Extended Data Fig. 3. Details of CTPS2 cryoEM structures.
(a,b) FSC curves for the S-state (a) and P-state (b) CTPS2 filament structures, showing resolutions of 3.5Å and 3.1Å, respectively, by the FSC0.143 criteria. (c,d) ResMap local resolution maps of the S-state (c) and P-state (d) CTPS2 filament structures. (e) CTPS2 tetramer, with monomers A-D shown in different colors. (f) Zoomed-in view of the orange box in (e), showing S-state CTPS2 (blue), P-state CTPS2 (dark grey), and S-state CTPS1 (light grey) filament structures aligned on the amidoligase domain of subunit A. S-state CTPS1 and CTPS2 are extended across the tetramer interface, compared to P-state CTPS2. (g) Monomers from the S-state (green) and P-state (dark grey) CTPS2 filament structures aligned on the amidoligase domain. (h) Zoomed-in view of the blue box in (g), with S-State CTPS1 also shown in light grey. The glutaminase domain is rotated by 7° towards the amidoligase domain in the S-state structure. (i,j) Two views of the S-state (color) and P-state (grey) CTPS2 monomers aligned on the glutaminase-amidoligase interface. (k) Zoomed-in view of the yellow box in (i). (l) Zoomed-in view of the orange box in (j). The glutaminase-amidoligase interface is essentially identical (Cα RMSD 0.8 Å) in the S-state and P-state filaments.

