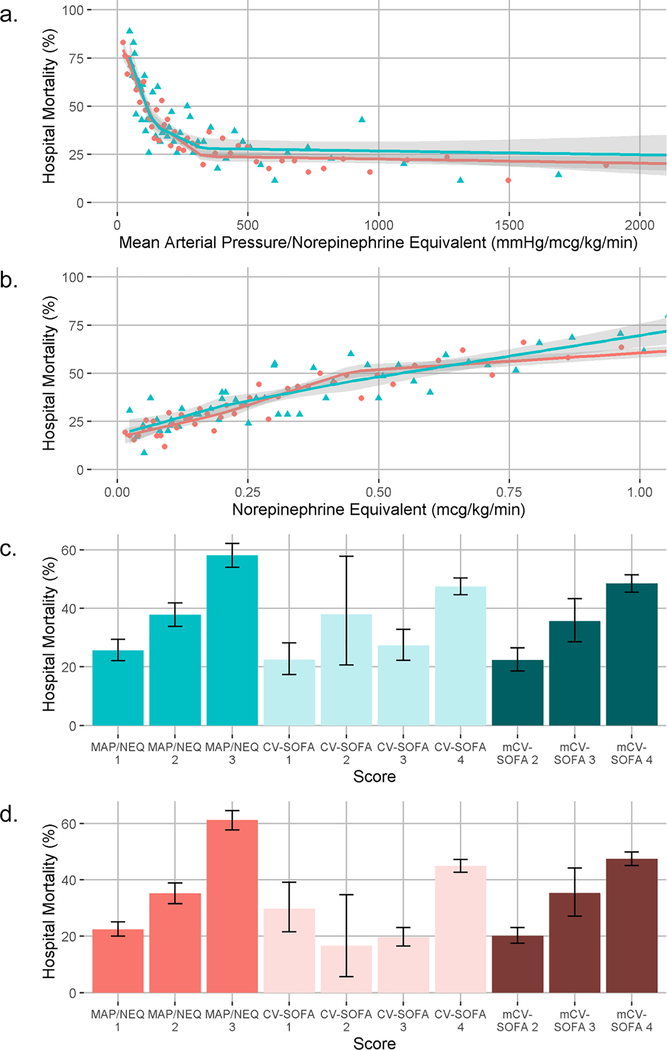
Fig.
a. Relationship between hospital mortality and mean arterial pressure/norepinephrine equivalent dose. Each point represents the percentage of patients who died in the hospital grouped from 50 quantiles of the mean arterial pressure/norepinephrine equivalent dose. Green triangles are from the MIMIC-III cohort, pink circles are from the eICU cohort. Overlying green and pink lines are fitted linear splines (knots at terciles) with 95% confidence intervals. b. Relationship between hospital mortality and norepinephrine equivalent dose. Each point represents the percentage of patients who died in the hospital grouped from 50 quantiles of the norepinephrine equivalent dose. Green triangles are from the MIMIC-III cohort, pink circles are from the eICU cohort. Overlying green and pink lines are fitted linear splines (knots at terciles) with 95% confidence intervals. c. Stratified mortality of 3-point mean arterial pressure/norepinephrine equivalent dose, cardiovascular sequential organ failure assessment score, and modified cardiovascular sequential organ failure assessment score in the MIMIC-III cohort. Bars show the percent of patients who died and 95% confidence intervals for each score category. d. Stratified mortality of 3-point mean arterial pressure/norepinephrine equivalent dose, cardiovascular sequential organ failure assessment score, and modified cardiovascular sequential organ failure assessment score in the eICU cohort. Bars show the percent of patients who died and 95% confidence intervals for each score category. MAP/NEQ: mean arterial pressure: norepinephrine equivalent dose; CV-SOFA: cardiovascular sequential organ failure assessment; mCV-SOFA: modified cardiovascular sequential organ failure assessment

