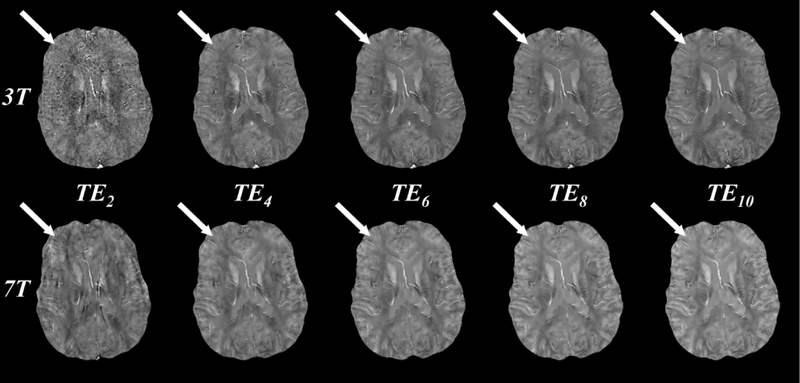
Figure 3.
QSM images reconstructed at 3T (top row) and 7T (bottom row) using the first 2, 4, 6, 8, and 10 echoes (columns 1 through 5, echo times through ). Image quality at 3T increases with increasing echo number as evidenced in the white-gray matter contrast (white arrows), while image quality at 7T remains similar after including 6 or more echoes. All images were obtained from a single 10 echo acquisition. Images at 7T are registered to those at 3T for visualization purposes only.

