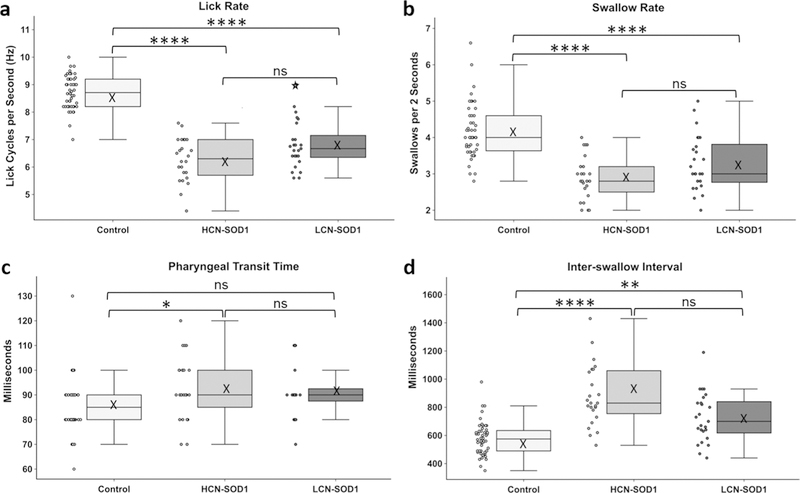
Fig. 6.
Videofluoroscopic evidence of dysphagia. The data distribution for the four statistically significant VFSS metrics is visually displayed by boxplots (median, quartiles, and whiskers, mean = X) with adjacent dotplots (individual data points) for the three groups of mice (control, HCN-SOD1, and LCN-SOD1). Compared to controls, both HCN-SOD1 and LCN-SOD1 mice had significantly altered swallow function at advanced disease stage, characterized by significantly slower lick (a) and swallow (b) rates, and significantly longer time between successive swallows (d; i.e., inter-swallow interval). In addition, pharyngeal transit time (c) was significantly longer for HCN-SOD1 but not LCN-SOD1 mice. However, none of the VFSS metrics were significantly different between HCN-SOD1 and LCN-SOD1 mice, thus highlighting the similarity in their dysphagia phenotype. Data points outside the whiskers are considered mild outliers; the star indicates an extreme outlier. Significance levels: p ≥ 0.05 (ns; nonsignificant), p< 0.05 (*), p< 0.01 (**), p < 0.001 (***), and p < 0.0001 (****). HCN-SOD1 high copy number SOD1-G93A mice (n = 24), LCN-SOD1 low copy number SOD1-G93A mice (n = 25), controls (n = 48) combined controls from HCN (n = 25) and LCN (n = 23) colonies

