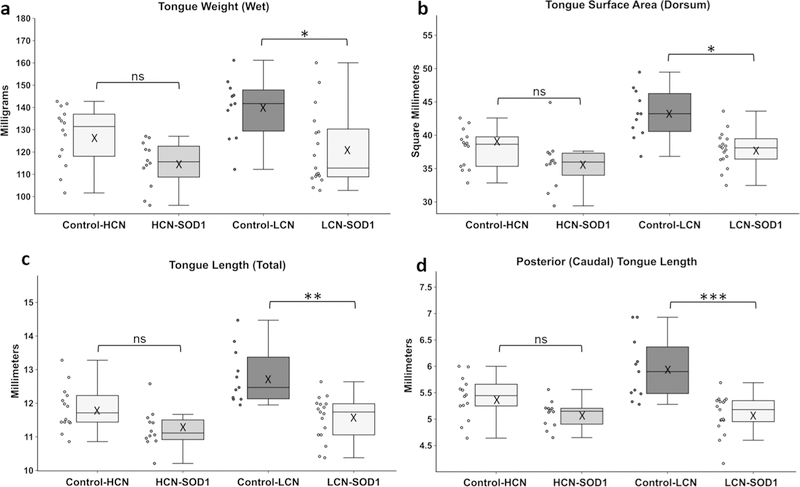
Fig. 8.
Evidence of tongue atrophy at advanced disease stage. Adjacent boxplots and dotplots show the data distribution of the four tongue-based measurements that were significantly reduced for LCN-SOD1 mice compared to age-matched controls: tongue weight (a), tongue surface area (b), total tongue length (c), and posterior (caudal) tongue length (d). These indicators of tongue atrophy were also apparent in HCN-SOD1 mice, but did not reach statistical significance. Data points outside the whiskers are considered mild outliers; there were no extreme outliers. Group sample sizes: HCN colony [controls: n = 14; 8 males and 6 females; HCN-SOD1: n = 12; 5 males and 7 females] and LCN colony [controls: n = 11; 5 males and 6 females; LCN-SOD1: n = 17; 8 males and 9 females]. Significance levels: p≥ 0.05 (ns nonsignificant), p< 0.05 (*), p< 0.01 (**), p < 0.001 (***), and p < 0.0001 (****), X mean

