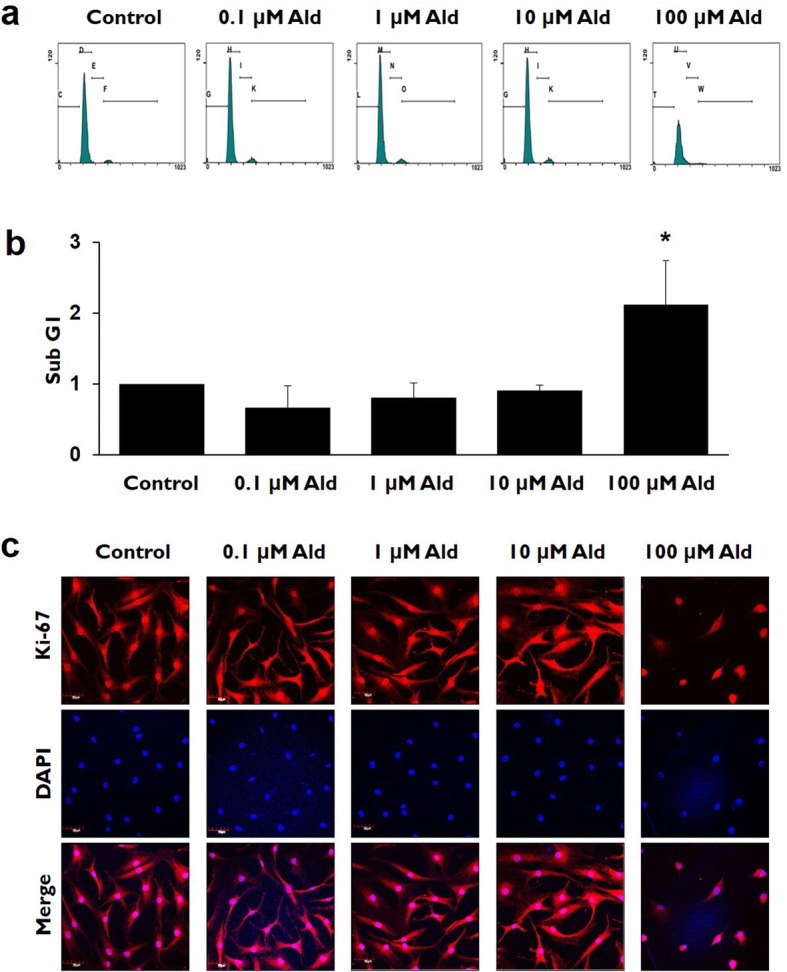
Fig. 3.

The comparisons of cell cycle and proliferation rates in various study groups. a and b The cell population of subG1 increased significantly in 100 μM Ald group, as compared with the control and the other studied groups (p ≤ 0.013). * represents the p values that are less than 0.05. c Immunocytochemical staining demonstrates that the Ki-67 positive cells representing cellular proliferation markedly decreased in 100 μM Ald group, as compared with the control and the other studied groups
