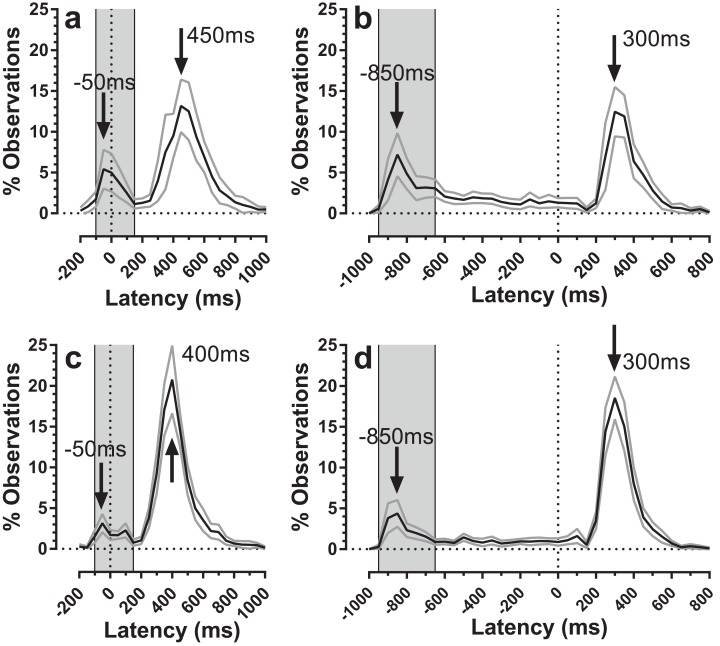
Figure 5. Average distributions of response timings for old and young participant groups.
Average distributions are shown for old (A and B) and young (C and D) participant groups. Bin width = 50 ms. For each participant, the % frequency distribution for responses was calculated. The mean (±95% CI) was then calculated for each bin across participants in each group. The black central line is plotted through the each mean bin value, while grey lines show ±95% CI. Target onset is at −200 for 200 ms TDD (A and C) and −1,000 ms for 1,000 ms TDD (B and D); target offset (the go signal) is at 0 ms (vertical dotted line). Arrows mark peak bins in each distribution for both errors and correct responses. Grey regions mark the bin ranges over which error rate was recalculated.

